UV Exposure Assessment
UV Radiation refers to the portion of the electromagnetic spectrum that lies between 100 and 400 nanometers (nm). It is divided into three sub‑ranges: UVA (315‑400 nm), UVB (280‑315 nm) and UVC (100‑280 nm). The energy of photons increases …
UV Radiation refers to the portion of the electromagnetic spectrum that lies between 100 and 400 nanometers (nm). It is divided into three sub‑ranges: UVA (315‑400 nm), UVB (280‑315 nm) and UVC (100‑280 nm). The energy of photons increases as the wavelength shortens, so UVC carries the highest photon energy, although it is largely absorbed by atmospheric oxygen and ozone before reaching the Earth’s surface. Understanding the distinction among these bands is essential because each band interacts with biological tissues in different ways, leading to varied health outcomes and safety requirements. For instance, UVA penetrates deeper into the dermis and contributes to photo‑aging, while UVB is primarily responsible for erythema and the synthesis of vitamin D. UVC, though seldom encountered outdoors, becomes a critical concern in industrial settings that use germicidal lamps.
The term UV Spectrum describes the distribution of power across the wavelength range of ultraviolet light. In exposure assessment, the spectrum is often represented by an action spectrum, which weights each wavelength according to its biological effectiveness for a specific outcome, such as skin reddening or cataract formation. By applying the appropriate action spectrum, a practitioner can convert a physical measurement of irradiance into an effective dose that reflects the true risk to the target tissue. In practice, this conversion is performed using a spectroradiometer that records the spectral irradiance and software that integrates the product of the measured spectrum and the action spectrum over the relevant wavelength interval.
Solar Irradiance is the power per unit area received from the Sun at a given location and is expressed in watts per square meter (W m⁻²). It includes contributions from the entire electromagnetic spectrum, but for UV safety the focus is on the ultraviolet portion. Solar irradiance varies with the solar zenith angle, atmospheric composition, cloud cover, and surface reflectivity. For example, on a clear summer day at solar noon, the UV component of solar irradiance may approach 30 W m⁻², whereas under overcast conditions the same location may receive less than 5 W m⁻². Accurate assessment of solar irradiance is the foundation for calculating exposure doses, establishing occupational exposure limits, and designing protective measures.
Radiance differs from irradiance in that it describes the amount of radiant energy emitted, reflected, or transmitted in a specific direction per unit solid angle per unit projected area. It is measured in watts per steradian per square meter (W sr⁻¹ m⁻²). In the context of UV safety, radiance is particularly important when evaluating point sources such as welding arcs, mercury vapor lamps, or UV‑C disinfection devices. Because radiance incorporates angular distribution, it allows the assessor to predict the intensity of UV exposure at various positions and orientations relative to the source. Practical applications include positioning of protective barriers, determining safe viewing distances, and configuring shielding to reduce stray UV radiation.
Dose is the cumulative amount of UV energy absorbed by a target over a specified period. It is typically expressed in joules per square meter (J m⁻²) or in more convenient units such as Standard Erythemal Dose (SED), where 1 SED = 100 J m⁻² of erythemally effective UV. The concept of dose integrates both the intensity of the radiation and the duration of exposure, making it a central metric for risk assessment. For instance, a worker who receives an average UVB irradiance of 0.2 W m⁻² for 30 minutes accrues a dose of 0.2 W m⁻² × 1800 s = 360 J m⁻², equivalent to 3.6 SED. Understanding how to calculate dose enables safety professionals to compare actual exposures against established limits such as the Maximum Permissible Exposure (MPE).
Effective Dose incorporates the weighting of each wavelength by an action spectrum, thereby reflecting the biological impact of the exposure rather than the raw energy. For skin erythema, the erythemal action spectrum defined by the International Commission on Non‑Ionizing Radiation Protection (ICNIRP) is used. The effective dose is obtained by multiplying the spectral irradiance by the action spectrum values and integrating across the UV range. This process yields a quantity expressed in SED or in Minimal Erythemal Dose (MED) units, where 1 MED is the dose required to produce the first perceptible reddening in a typical skin type. By converting to effective dose, assessors can directly relate measurements to health outcomes and regulatory limits.
Action Spectrum is a curve that represents the relative effectiveness of different UV wavelengths for producing a specific biological response. Each action spectrum is derived from experimental data and is unique to the endpoint of interest, such as DNA damage, cataract formation, or vitamin D synthesis. The most widely used action spectra in UV safety are the erythemal, photokeratitis, and photoconjunctivitis spectra. When evaluating exposure, the assessor selects the action spectrum that matches the health effect under consideration, multiplies the measured spectral irradiance by the spectrum, and integrates to obtain the effective dose. The choice of action spectrum can dramatically influence the assessment outcome; for example, using the erythemal spectrum will assign greater weight to UVB wavelengths than a photokeratitis spectrum, which emphasizes UV‑C and short‑wave UVB.
Sunburn Threshold, commonly expressed as the Minimal Erythemal Dose (MED), varies with skin phototype, age, and acclimatization. For a fair‑skinned individual (phototype I), the MED is approximately 200 J m⁻², whereas for a darker phototype (phototype IV) it may be as high as 800 J m⁻². Knowledge of the MED is essential for establishing safe exposure times. If the measured erythemal effective irradiance is 0.1 W m⁻², a person with a MED of 200 J m⁻² can remain in the sun for 200 J m⁻² ÷ 0.1 W m⁻² = 2000 s, or roughly 33 minutes, before reaching the sunburn threshold. This calculation forms the basis for public health advisories and workplace exposure limits.
Standard Erythemal Dose (SED) provides a convenient unit for reporting erythemally effective UV exposure. One SED equals 100 J m⁻² of effective UV energy, which simplifies dose calculations and communication. For example, a UV monitoring instrument that records an effective irradiance of 0.5 W m⁻² will accumulate 0.5 W m⁻² × 60 s = 30 J m⁻² per minute, or 0.3 SED per minute. By expressing doses in SED, safety professionals can quickly compare observed values to the recommended limit of 30 SED per day for the general public, as set by many health agencies.
UV Index is a dimensionless number that conveys the level of solar UV radiation at the Earth’s surface, scaled to reflect the risk of erythema. It is derived from the erythemally weighted irradiance, multiplied by a factor of 40 m² W⁻¹. An index value of 0–2 indicates low exposure, 3–5 moderate, 6–7 high, and 8 or above very high. The UV Index is widely used in public health messaging because it translates a technical measurement into an easy‑to‑understand risk level. For occupational settings, the UV Index can be employed as a rapid screening tool to decide whether additional protective measures, such as shade structures or protective clothing, are required.
UV Dose Rate is the instantaneous rate at which effective UV energy is being delivered to a surface, expressed in SED per minute or in J m⁻² s⁻¹. It is derived from the effective irradiance and is useful for real‑time monitoring. For instance, a portable UV dosimeter may display a dose rate of 0.4 SED min⁻¹, indicating that a worker would reach a cumulative dose of 4 SED in ten minutes if the exposure remained constant. Monitoring dose rate helps identify periods of peak exposure, such as mid‑day solar noon, and informs the implementation of time‑based controls.
Cumulative Exposure refers to the total dose accumulated over a defined period, which may be a work shift, a week, or a lifetime. Cumulative exposure is particularly relevant for chronic health effects such as skin cancer, where risk increases with the total number of SEDs received over many years. In occupational health programs, cumulative exposure is tracked using personal dosimeters that record each exposure event. Data from these devices can be aggregated to produce an individual’s exposure history, which is then compared against epidemiological thresholds for increased cancer risk.
Personal Dosimeter is a wearable instrument that measures the UV dose received by an individual. Modern dosimeters often incorporate silicon photodiodes with spectral filters that approximate the erythemal action spectrum. They store data electronically, allowing for later download and analysis. The key advantages of personal dosimeters are their ability to capture spatially variable exposures and to reflect the actual conditions experienced by the worker, rather than relying on static ambient measurements. Practical challenges include ensuring proper placement on the body (e.g., on the forearm rather than under a sleeve), calibrating the device against a reference instrument, and managing data integrity over long monitoring periods.
Radiometer is a general term for an instrument that measures radiant power, typically in the form of irradiance. In UV safety, a UV radiometer is equipped with a detector and a set of filters that provide a broadband measurement of UV irradiance, often weighted to the erythemal or UV‑C spectrum. Radiometers are useful for quick field checks, but they lack the spectral resolution of a spectroradiometer. Consequently, they may underestimate or overestimate effective dose if the ambient spectrum deviates from the calibration spectrum. Users must be aware of these limitations and, when high accuracy is required, supplement radiometer readings with spectrally resolved data.
Spectroradiometer measures the spectral distribution of radiant energy across a range of wavelengths, delivering data in units of W m⁻² nm⁻¹. It is the gold‑standard instrument for UV exposure assessment because it captures the full spectrum, enabling precise application of action spectra. A spectroradiometer typically consists of a diffraction grating, a detector array, and a calibration system. While the device provides unparalleled accuracy, it is more expensive, requires careful handling, and necessitates regular calibration against a traceable standard lamp. In practice, a spectroradiometer is deployed for baseline site characterisation, validation of other instruments, and research studies that develop or refine action spectra.
UVB Index and UVA Index are specialized indices that isolate the contribution of UVB (280‑315 nm) and UVA (315‑400 nm) to the overall UV Index. They are derived by applying band‑specific weighting functions rather than the full erythemal action spectrum. These indices are valuable when assessing risks that are more closely associated with one band, such as photokeratitis (primarily UVB) or photo‑aging (primarily UVA). For example, a UVB Index of 7 indicates a high risk of acute skin damage, while a UVA Index of 4 suggests moderate long‑term effects. By separating the bands, safety professionals can tailor mitigation strategies, such as selecting filters that preferentially block UVB while allowing some UVA transmission for vitamin D synthesis.
Ground Reflectance, also known as albedo, describes the fraction of incident UV radiation that is reflected by a surface back into the atmosphere. Different surfaces have markedly different albedos: fresh snow can reflect up to 80 % of UV, sand around 20 %, while asphalt reflects less than 5 %. High ground reflectance can significantly increase exposure, especially in environments where the sun is low on the horizon. For instance, a worker on a snowy field may receive a total UV dose that is 1.5 times higher than the direct solar component alone. Accurate assessment of ground reflectance is therefore essential for calculating the total exposure in reflective environments.
Atmospheric Ozone absorbs strongly in the UVB and UVC regions, protecting life on Earth from the most harmful wavelengths. The total column of ozone is measured in Dobson Units (DU), where 1 DU corresponds to a 0.01 cm thickness of ozone at standard temperature and pressure. A typical mid‑latitude column is about 300 DU. During an ozone “hole” event, values can drop below 200 DU, leading to increased UVB irradiance at the surface. In exposure assessment, ozone data from satellite or ground‑based instruments is incorporated to adjust the predicted UV spectrum for a given location and time. Failure to account for ozone variations can result in under‑ or over‑estimation of effective dose.
Ozone Column measurement is often obtained from ground‑based Dobson spectrophotometers or from satellite sensors such as the Ozone Monitoring Instrument (OMI). The column value is used in radiative transfer models to compute the attenuation of UVB radiation by ozone. For example, a reduction of 20 DU in the ozone column can increase the UVB component of solar irradiance by roughly 10 %. This relationship is non‑linear and depends on solar zenith angle, so professional software packages incorporate detailed look‑up tables to convert ozone column data into spectral attenuation factors.
UV Transmittance describes the fraction of UV radiation that passes through a material, such as glass, plastic, or protective clothing. It is wavelength‑dependent, with many common glasses transmitting only UVA while blocking most UVB. The transmittance curve of a material is often expressed as a percentage versus wavelength. For protective purposes, materials are selected based on their ability to reduce transmittance to below a target level, such as ≤ 1 % for UVB in safety glasses. In practice, the transmittance of a filter is measured using a spectroradiometer, and the resulting data is applied to the incident spectrum to calculate the transmitted effective dose.
Filtering can be achieved through the use of coatings, films, or additives that absorb or scatter UV photons. For example, polycarbonate lenses are often tinted with a UV‑absorbing dye that reduces UVB transmission to less than 0.5 %. In industrial environments, filters are placed on lamp housings to limit stray UV emission. The effectiveness of filtering is quantified by the optical density (OD), where OD = ‑log₁₀(transmittance). An OD of 2 corresponds to 1 % transmittance, while an OD of 3 corresponds to 0.1 % transmittance. Selecting the appropriate OD level is a balance between protection and functional requirements such as visible light transmission.
Protective Clothing is evaluated based on its Ultraviolet Protection Factor (UPF), which indicates how much UV radiation is blocked by the fabric. A UPF of 50 means that only 1 % of the incident UV radiation reaches the skin. The UPF rating depends on factors such as fiber type, weave density, color, and any chemical treatments. Dark, tightly woven fabrics typically achieve higher UPF values than light, loosely woven ones. In practice, safety professionals conduct fabric testing using a spectroradiometer equipped with a standard light source and a set of reference detectors to determine the UPF. The resulting value guides recommendations for work‑wear, especially in outdoor occupations where prolonged exposure is likely.
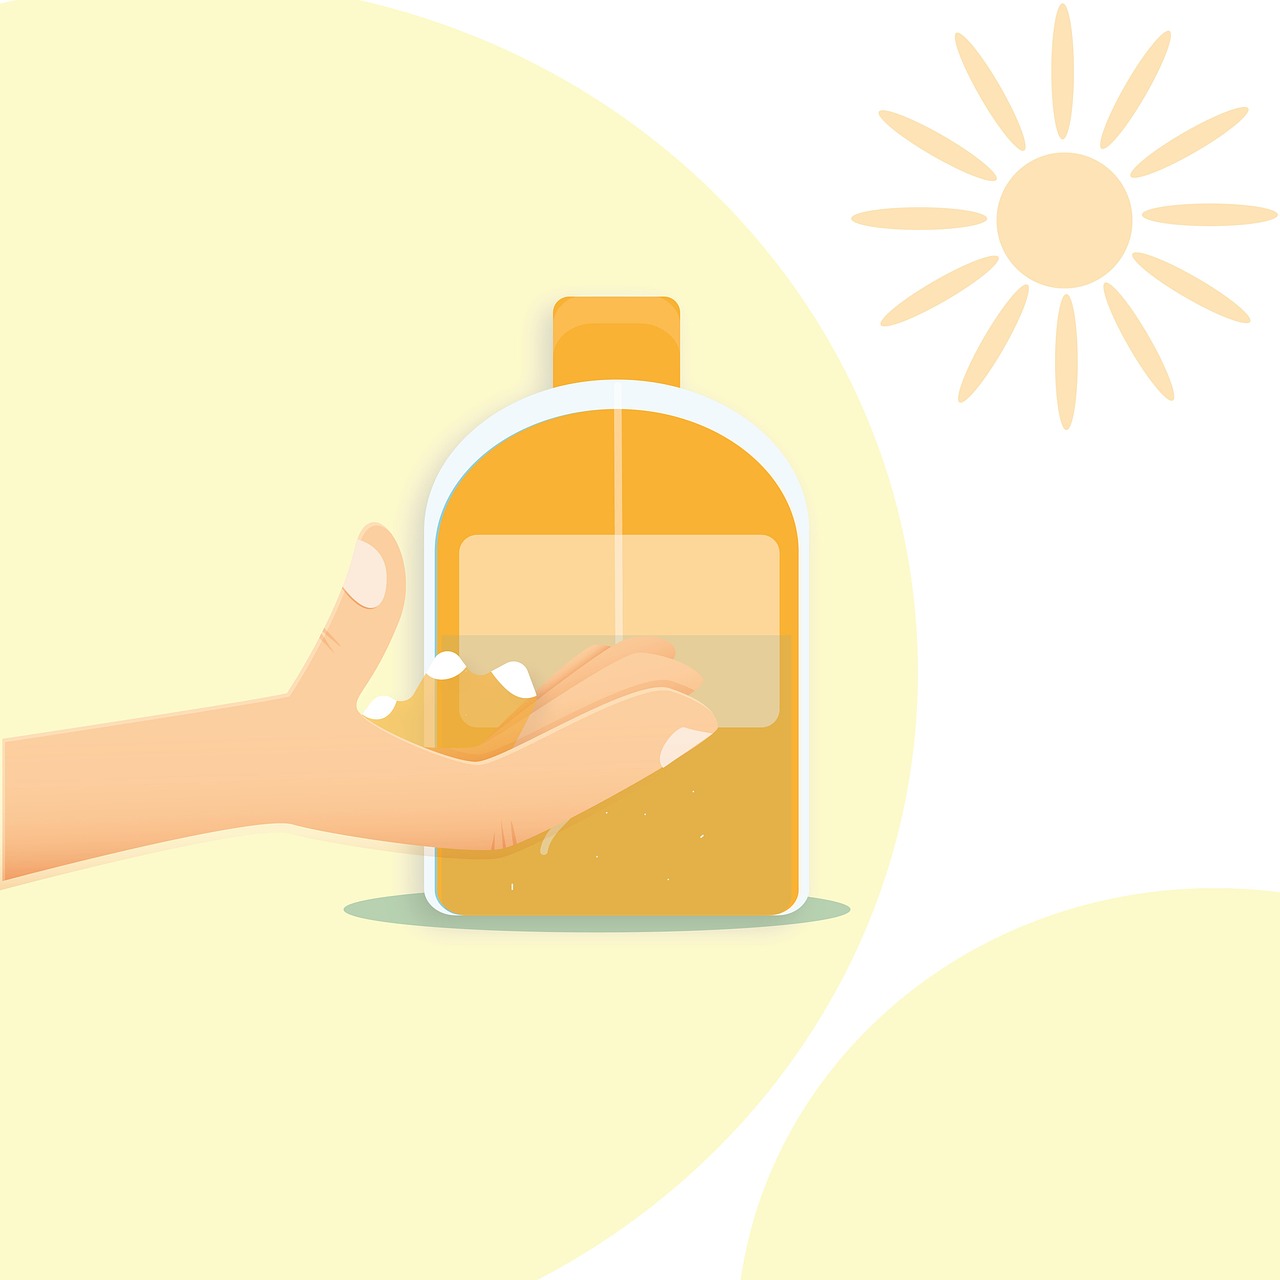
Sun Protection Factor (SPF) is a metric used for sunscreens rather than clothing. SPF is defined as the ratio of the minimal erythemal dose (MED) on protected skin to the MED on unprotected skin under the same UV conditions. An SPF 30 product, for example, theoretically allows a person to remain in the sun 30 times longer before reaching the MED. However, real‑world effectiveness is influenced by application thickness, re‑application frequency, and water resistance. In occupational settings, SPF is relevant when workers are required to apply sunscreen in addition to wearing protective clothing. Safety policies often stipulate a minimum SPF value (e.g., SPF 30) and provide guidance on proper application techniques.
UV‑Protective Fabrics may be engineered with special fibers or coated with UV‑absorbing compounds. For high‑risk tasks such as welding or UV‑C disinfection, fabrics are selected to achieve UPF > 100, providing an additional safety margin. Some fabrics incorporate titanium dioxide nanoparticles, which scatter UV radiation and increase protection without significantly altering the tactile properties of the material. Manufacturers provide UPF testing data that must be verified by the end‑user through independent measurement, especially when the fabric is part of a certified personal protective equipment (PPE) ensemble.
UV‑Induced Skin Cancer encompasses both basal cell carcinoma (BCC) and squamous cell carcinoma (SCC), as well as malignant melanoma. Epidemiological studies have established a dose‑response relationship between cumulative UV exposure and the incidence of these cancers. The risk is often expressed as relative risk per SED or per MED accumulated over a lifetime. For example, each additional 1000 SED of cumulative exposure may increase melanoma risk by roughly 5 %. Understanding this relationship informs occupational exposure limits and the implementation of long‑term monitoring programs.
Photokeratitis is an acute, painful inflammation of the cornea caused primarily by UVB and UVC exposure. It is sometimes referred to as “snow blindness” when it occurs after reflection from snow. The onset is rapid, typically within minutes of exposure, and symptoms include tearing, photophobia, and a sensation of a foreign body in the eye. The condition is self‑limiting, resolving within 24–48 hours, but repeated incidents can lead to more serious ocular damage. In safety assessments, the photokeratitis action spectrum is used to calculate the effective dose to the eye, and exposure limits are set to keep the dose below the threshold for measurable corneal damage.
Cataract formation is a long‑term effect of chronic UV exposure, particularly UVB, which can accelerate lens opacity. The latency period can span decades, making it a cumulative risk. Epidemiological data suggest that individuals with occupational UV exposure accumulate a higher incidence of cataract compared to the general population, even after adjusting for age and other risk factors. Protective measures for the eye include the use of UV‑blocking goggles with a certified optical density, as well as ensuring that protective eyewear fits properly to avoid peripheral leakage.
Photochemical Reaction in the context of UV safety refers to the process by which UV photons cause chemical changes in biological molecules, such as the formation of pyrimidine dimers in DNA. These reactions are the underlying mechanisms for both acute effects (e.g., erythema) and chronic effects (e.g., carcinogenesis). The rate of photochemical reactions depends on the spectral quality of the UV source, the presence of photosensitizers, and the repair capacity of the organism. Safety assessments often use action spectra that are derived from measured rates of specific photochemical reactions, allowing the translation of physical measurements into biologically relevant risk metrics.
Photobiological Safety encompasses the evaluation of hazards associated with exposure to ultraviolet, visible, and infrared radiation. Standards such as IEC 62471 define test methods for assessing the photobiological risk of lamps, LEDs, and other light‑emitting devices. In an advanced UV safety course, students learn to apply these standards to determine whether a product is “low risk” or requires additional controls. The assessment process includes measuring spectral output, calculating effective irradiance using relevant action spectra, and comparing the results to threshold limits for the eye and skin.
Exposure Limit is a regulatory or guideline value that defines the maximum acceptable level of UV radiation for a given exposure scenario. Different jurisdictions may use terms such as Maximum Permissible Exposure (MPE), Threshold Limit Value (TLV), or Occupational Exposure Limit (OEL). For example, the ICNIRP recommends a limit of 30 J m⁻² (0.3 SED) for an 8‑hour workday for unprotected skin, while the ACGIH TLV for UVB may be expressed as 0.1 J cm⁻² per 8‑hour shift, depending on the action spectrum applied. Understanding the basis and units of each limit is crucial for compliance and for designing appropriate control measures.
Maximum Permissible Exposure (MPE) is a term used primarily in the United States by the Occupational Safety and Health Administration (OSHA) and the American National Standards Institute (ANSI). The MPE is defined for each UV band and takes into account the most sensitive tissue, typically the cornea for UVC and the epidermis for UVB. For instance, the MPE for UVC (254 nm) is 6 J m⁻² for an 8‑hour exposure, while for UVB the limit may be 30 J m⁻². These limits are based on preventing acute injuries such as photokeratitis and erythema, respectively.
Threshold Limit Value (TLV) is a term employed by the ACGIH to denote the level of exposure that most workers can experience without adverse health effects over a working lifetime. TLVs are often expressed as a time‑weighted average (TWA) over an 8‑hour shift. For UV radiation, TLVs are derived from epidemiological data and incorporate safety factors to account for inter‑individual variability. When a TLV is exceeded, employers must implement engineering controls, administrative controls, or PPE to bring the exposure back within acceptable bounds.
Time‑Weighted Average (TWA) is a statistical method for averaging exposure over a work shift, taking into account variations in intensity throughout the day. The TWA is calculated by integrating the instantaneous dose rate over the exposure period and dividing by the total time. For example, if a worker experiences a dose rate of 0.5 SED min⁻¹ for 30 minutes and 0.1 SED min⁻¹ for the remaining 210 minutes of an 8‑hour shift, the TWA would be (0.5 × 30 + 0.1 × 210) ÷ 240 = 0.175 SED min⁻¹. This value can be compared directly to the TLV or MPE expressed as a TWA to determine compliance.
Exposure Assessment is the systematic process of estimating the magnitude, frequency, and duration of UV radiation that a person or group may encounter. It involves identifying sources, measuring or modeling irradiance, applying action spectra, and calculating effective doses. A comprehensive exposure assessment may combine direct measurements (e.g., personal dosimeters) with predictive models (e.g., radiative transfer codes) to fill gaps where measurements are unavailable. The output of an exposure assessment is typically a dose profile that can be used to evaluate risk, guide control strategies, and document compliance with regulatory limits.
Risk Assessment builds upon exposure assessment by incorporating the probability and severity of adverse health outcomes. In UV safety, risk assessment often uses dose‑response curves derived from epidemiological studies to estimate the likelihood of skin cancer, cataract, or photokeratitis for a given cumulative dose. The risk estimate can be expressed as an incremental lifetime risk (e.g., an additional 1 % chance of melanoma) or as a hazard quotient (the ratio of estimated dose to a reference dose). Decision‑making tools such as risk matrices help prioritize control measures based on the magnitude of risk and the feasibility of mitigation.
Hazard Identification is the first step in the safety management process, where potential sources of UV radiation are catalogued. This may include natural sources (sunlight), artificial sources (germicidal lamps, welding arcs, UV‑C LEDs), and secondary sources (reflected UV from snow or water). Each identified hazard is characterized by its spectral output, intensity, operating schedule, and spatial distribution. Proper documentation of hazards enables targeted monitoring and control strategies, ensuring that resources are allocated to the most significant sources of exposure.
Control Measures are actions taken to reduce UV exposure to acceptable levels. They are typically organized into a hierarchy: engineering controls (e.g., shielding, enclosure), administrative controls (e.g., work‑schedule rotation, training), and personal protective equipment (PPE). For UV hazards, engineering controls are preferred because they eliminate the source or barrier exposure without relying on worker behavior. However, where engineering controls are impractical, PPE such as UV‑blocking goggles, face shields, and UPF‑rated clothing become essential. The effectiveness of each control measure must be verified through measurement or modeling to confirm that the residual exposure complies with the established limits.
Engineering Controls for UV safety include physical barriers, interlocks, and enclosure designs that prevent radiation from reaching workers. For example, a welding station may be equipped with a glass curtain that transmits less than 0.1 % of UVB, thereby reducing the dose to the surrounding area. Other engineering solutions involve the use of low‑pressure mercury lamps with built‑in filters, or the selection of LED sources that emit negligible UVB. In the design phase, engineers employ radiative transfer simulations to predict the distribution of UV irradiance and to optimize shielding geometry.
Administrative Controls involve policies and procedures that limit exposure duration or modify work practices. Examples include scheduling outdoor tasks for early morning or late afternoon when solar UV is lower, rotating workers to limit individual cumulative dose, and mandating the use of sunscreen or protective clothing during high‑UV periods. Administrative controls also encompass training programs that teach workers how to recognize UV hazards, properly don and doff PPE, and understand the significance of UV Index forecasts. While these controls are less reliable than engineering solutions, they are indispensable when engineering options are constrained by cost or operational requirements.
Personal Protective Equipment (PPE) in UV safety includes items such as goggles, face shields, aprons, gloves, and clothing specifically rated for UV attenuation. The selection of PPE must consider the spectral characteristics of the source, the required protection factor, and the comfort of the wearer to ensure compliance. For instance, a UVC lamp used for surface disinfection may require goggles with an optical density of at least 3 at 254 nm, while a UVB welding operation may be adequately protected with goggles rated for UVB transmittance ≤ 0.1 %. Proper fit testing and regular inspection of PPE are critical to maintain effectiveness over time.
UV Monitoring Program is a structured approach to regularly measuring and documenting UV exposure in a workplace. The program typically defines the monitoring frequency, the types of instruments used, the locations for fixed sensors, and the procedures for personal dosimetry. Data from the program are analyzed to identify trends, verify compliance with exposure limits, and evaluate the performance of control measures. An effective UV monitoring program also incorporates a feedback loop, whereby findings are communicated to workers and management, leading to adjustments in work practices or engineering controls as needed.
Calibration is the process of adjusting an instrument’s response to align with a known reference standard. For UV measurement devices, calibration involves exposing the instrument to a source with a certified spectral output and recording the instrument’s reading. The resulting correction factors are applied to subsequent measurements to ensure accuracy. Calibration must be performed regularly—typically annually or after any event that could affect the instrument’s performance, such as a drop or exposure to extreme temperatures. Maintaining a calibration traceability chain to national standards (e.g., NIST) is required for compliance with many regulatory frameworks.
Quality Assurance in UV exposure assessment encompasses procedures that guarantee the reliability and repeatability of measurements. This includes routine checks of instrument performance, documentation of calibration certificates, periodic inter‑comparison of devices, and the implementation of standard operating procedures (SOPs) for data collection. A robust QA program reduces measurement uncertainty, which is crucial when the calculated dose is close to regulatory limits. QA also involves training personnel in proper measurement techniques, ensuring that they understand the importance of instrument orientation, shading, and environmental influences on readings.
Uncertainty quantifies the range within which the true value of a measured or calculated quantity is expected to lie. In UV exposure assessment, uncertainty arises from instrument accuracy, calibration errors, spectral mismatch, environmental variability, and human factors. It is expressed as a standard deviation or as a confidence interval (e.g., ± 10 %). Properly accounting for uncertainty is essential when decisions hinge on whether an exposure exceeds a limit; a conservative approach may add the uncertainty margin to the measured dose to avoid under‑estimation of risk.
Measurement Error can be systematic (bias) or random (noise). Systematic errors often stem from mis‑calibration, spectral mismatch between the instrument and the source, or improper use of filters. Random errors are typically associated with detector noise, fluctuations in source intensity, or environmental conditions such as temperature changes. Reducing measurement error involves regular calibration, using instruments with appropriate spectral response, and employing averaging techniques to diminish random noise. Documentation of error sources and mitigation strategies is a key component of the QA process.
Spectral Calibration ensures that the instrument’s response across the entire UV wavelength range matches the true spectral distribution of the source. This is achieved by exposing the device to a series of monochromatic calibration lamps or to a tunable source that sweeps across the UV band. The resulting correction factors are stored in the instrument’s software, allowing it to output spectrally accurate irradiance values. Spectral calibration is particularly important for spectroradiometers, which are used to derive action‑spectrum weighted doses. Without accurate spectral calibration, the effective dose calculation could be significantly biased, leading to either over‑protection or under‑protection.
Radiometric Calibration deals with the absolute scaling of measured power, ensuring that the instrument reports correct irradiance values in physical units (W m⁻²). This is performed using a reference source with a known radiometric output, such as a NIST‑traceable blackbody or a calibrated UV lamp. Radiometric calibration complements spectral calibration; together they provide a complete characterization of the instrument’s performance. In practice, radiometric calibration is performed less frequently than spectral calibration because it is more time‑consuming and the absolute scale of most instruments remains stable over longer periods.
Instrument Sensitivity describes how responsive a detector is to incoming photons. Sensitivity is wavelength‑dependent; silicon photodiodes, for example, have peak sensitivity around 600 nm and reduced response in the deep‑UV. To improve UV sensitivity, detectors may be coated with materials such as cesium telluride (CsTe) that enhance quantum efficiency in the UVB and UVC ranges. The choice of detector influences the instrument’s ability to capture low‑level UV signals, which is critical when assessing exposure in shaded or indoor environments where irradiance may be close to the detection limit.
Detector Response includes not only the sensitivity but also the temporal behavior of the detector, such as rise time and after‑glow. Fast response is essential for capturing transient spikes in UV intensity, such as those produced by flash lamps or arc welding arcs. Slow response can lead to under‑estimation of peak dose rates, potentially causing a breach of instantaneous exposure limits. For applications requiring high temporal resolution, photomultiplier tubes (PMTs) or avalanche photodiodes (APDs) are often employed despite their higher cost and more complex handling requirements.
Dark Current is the small electrical current that flows through a detector even in the absence of light. It contributes to the baseline noise and can become significant when measuring low UV levels. Dark current can be reduced by cooling the detector, using low‑leakage components, or by performing a background subtraction during data processing. In field deployments, instruments often perform an automatic dark‑current measurement before each recording session to compensate for temperature‑dependent variations.
Noise in UV measurement systems originates from several sources, including photon shot noise, electronic readout noise, and environmental interference. The signal‑to‑noise ratio (SNR) determines the reliability of low‑level measurements. Improving SNR can be achieved by increasing integration time, using larger detector areas, or employing signal averaging techniques. For real‑time monitoring where rapid response is required, a trade‑off exists between temporal resolution and noise reduction; the assessor must select an appropriate balance based on the hazard’s characteristics.
Signal‑to‑Noise Ratio is a metric that compares the magnitude of the desired UV signal to the level of background noise. A high SNR (e.g., > 20 dB) indicates a clear measurement, while a low SNR may render the data unreliable. In practice, instruments display the SNR as part of the measurement output, allowing the operator to judge data quality instantly. When the SNR falls below a predefined threshold, the measurement may be flagged for repeat or for exclusion from the final dose calculation.
Data Logging refers to the continuous recording of UV measurements over time. Modern instruments store timestamps, irradiance values, temperature, and instrument status in internal memory or on external storage devices. Data logging enables the creation of exposure time series, which are essential for calculating cumulative dose, identifying peak exposure periods, and performing trend analysis. In occupational settings, data logs are often exported to spreadsheet or database software for further processing, statistical analysis, and reporting to regulatory bodies.
Real‑Time Monitoring provides immediate feedback on UV levels, allowing workers to adjust their behavior or for automated systems to trigger protective actions. For example, a real‑time UV
Key takeaways
- The energy of photons increases as the wavelength shortens, so UVC carries the highest photon energy, although it is largely absorbed by atmospheric oxygen and ozone before reaching the Earth’s surface.
- In practice, this conversion is performed using a spectroradiometer that records the spectral irradiance and software that integrates the product of the measured spectrum and the action spectrum over the relevant wavelength interval.
- For example, on a clear summer day at solar noon, the UV component of solar irradiance may approach 30 W m⁻², whereas under overcast conditions the same location may receive less than 5 W m⁻².
- Radiance differs from irradiance in that it describes the amount of radiant energy emitted, reflected, or transmitted in a specific direction per unit solid angle per unit projected area.
- It is typically expressed in joules per square meter (J m⁻²) or in more convenient units such as Standard Erythemal Dose (SED), where 1 SED = 100 J m⁻² of erythemally effective UV.
- This process yields a quantity expressed in SED or in Minimal Erythemal Dose (MED) units, where 1 MED is the dose required to produce the first perceptible reddening in a typical skin type.
- When evaluating exposure, the assessor selects the action spectrum that matches the health effect under consideration, multiplies the measured spectral irradiance by the spectrum, and integrates to obtain the effective dose.