
Process Optimization And Control
Process optimization in petroleum refining is the systematic approach to adjust operating conditions, feedstock selection, and equipment configuration in order to maximize economic returns while meeting product specifications and environmen…
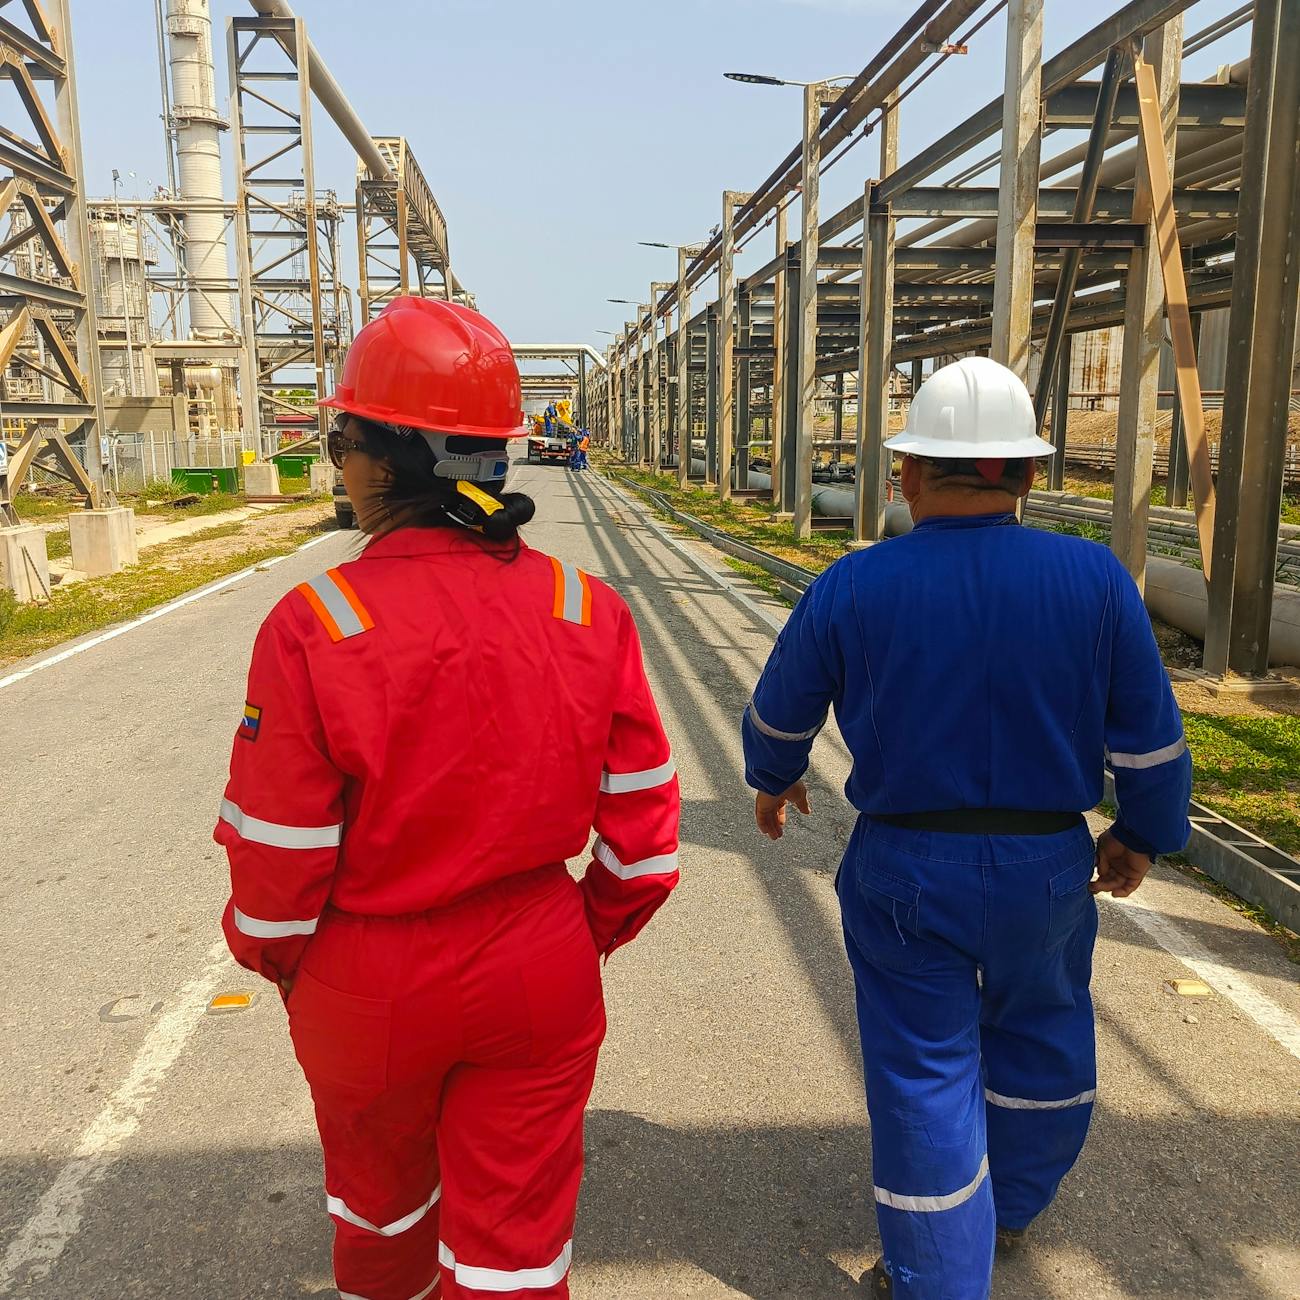
Process optimization in petroleum refining is the systematic approach to adjust operating conditions, feedstock selection, and equipment configuration in order to maximize economic returns while meeting product specifications and environmental constraints. The term is often paired with process control, which refers to the real‑time actions taken to keep the plant operating at the chosen optimum. Understanding the vocabulary that underpins these activities is essential for any professional seeking the Advanced Skill Certificate in Petroleum Refining and Petrochemistry.
Steady‑state describes a condition in which all process variables such as temperature, pressure, flow rates, and compositions remain constant over time, despite ongoing material and energy flows. In a refinery, a steady‑state simulation of a distillation column predicts the temperature profile and product cuts when the feed composition and reflux ratio are fixed. Achieving a true steady‑state in a real plant is challenging because feed quality, ambient temperature, and equipment wear introduce continual disturbances.
Dynamic simulation extends the steady‑state concept by incorporating the time‑dependent behavior of equipment. It captures how a column responds to a sudden change in feed rate or a control valve adjustment. Dynamic models are written as sets of differential equations that represent mass and energy balances for each stage or unit. These models are indispensable for designing control strategies, performing startup and shutdown studies, and evaluating the impact of process upsets.
Control loop is the basic building block of process control. It consists of a sensor that measures a process variable (PV), a controller that compares the PV with a desired setpoint (SP), and a final control element (FCE) such as a valve that manipulates the process. For example, a temperature control loop on a reactor uses a thermocouple (sensor), a PID controller (controller), and a steam valve (FCE) to maintain the reactor temperature at the target value.
PID controller stands for Proportional‑Integral‑Derivative controller. The proportional term provides an immediate response proportional to the error (SP‑PV). The integral term eliminates steady‑state offset by accumulating error over time, while the derivative term anticipates future error based on the rate of change. Proper tuning of the three parameters (Kp, Ki, Kd) is vital; an overly aggressive proportional gain can cause oscillations, whereas insufficient integral action may leave a persistent offset.
Setpoint is the target value that the controller strives to achieve for a particular variable. In a hydrocracking unit, the setpoint for reactor pressure might be 1500 kPa, while the setpoint for reactor temperature could be 380 °C. Setpoints are often adjusted dynamically in response to market demand, feedstock changes, or optimization calculations.
Process variable (PV) is the actual measured value that the control system monitors. It can be temperature, pressure, flow, level, composition, or any other quantity that influences product quality or safety. Accurate PV measurement is critical; sensor drift or fouling can lead to erroneous control actions and potential off‑spec production.
Manipulated variable (MV) is the variable that the controller directly changes to influence the PV. In the hydrocracking example, the MV might be the steam flow to the reactor heating system. The relationship between MV and PV is described by the process gain, time constant, and dead time.
Dead time (also called transport delay) is the period between a change in the MV and the observable effect on the PV. Large dead times are common in long pipelines or large heat exchangers and limit the achievable control performance. Techniques such as dead‑time compensation or predictive control are employed to mitigate its adverse effects.
Gain quantifies how much the PV changes in response to a unit change in the MV. If a valve opening of 1 % causes the reactor temperature to rise by 0.5 °C, the gain is 0.5 °C per percent valve opening. Knowing the gain helps in sizing the controller and selecting appropriate tuning parameters.
Disturbance is any external influence that alters the PV without a corresponding change in the MV. In a refinery, variations in feedstock sulfur content, ambient temperature swings, or fouling of heat‑transfer surfaces are typical disturbances. Effective control strategies aim to reject disturbances quickly, maintaining product quality within specifications.
Feedback control uses the measured PV to correct deviations from the setpoint. It is the most common control mode because it does not require a model of the process. However, feedback alone may be insufficient when disturbances are large or when dead time is significant.
Feedforward control anticipates the effect of measurable disturbances by adjusting the MV before the PV deviates. For instance, if the feed flow to a distillation column increases, a feedforward controller can open the reflux valve pre‑emptively to maintain the column’s internal liquid balance. Feedforward is often combined with feedback to achieve superior performance.
Economic optimization seeks the operating point that maximizes profit, often expressed as the difference between revenue from products and the cost of raw materials, utilities, and operating expenses. In a catalytic cracking unit, the objective function could be to maximize the value of gasoline produced while minimizing coke formation and energy consumption. Economic optimization typically requires a detailed process model and accurate cost data.
Linear programming (LP) is a mathematical technique for optimizing a linear objective function subject to linear equality and inequality constraints. LP is widely used for short‑term refinery planning, such as determining the optimal blend of crude oils to meet product specifications at minimum cost. The method assumes that relationships between variables are linear, which is a reasonable approximation for many blending problems.
Nonlinear programming (NLP) extends LP to handle nonlinear objective functions and constraints. Many refinery processes, such as reaction kinetics and thermodynamic equilibria, are inherently nonlinear. NLP solvers can find the optimal operating conditions for a reformer unit where the relationship between reactor temperature, conversion, and product octane is nonlinear.
Model predictive control (MPC) is an advanced control strategy that uses a dynamic model of the process to predict future PV behavior over a moving horizon. At each control interval, the MPC solves an optimization problem to compute the MV trajectory that minimizes a cost function, typically a weighted sum of tracking error and MV movement. MPC can handle multivariable interactions, constraints on MV and PV, and can incorporate feedforward information. It is especially valuable in complex units like hydrocrackers, where temperature, pressure, and hydrogen flow are tightly coupled.
Real‑time optimization (RTO) integrates MPC with an economic optimizer to continuously drive the plant toward the profit‑maximizing operating point. The RTO layer updates the economic objective based on current market prices, feedstock costs, and utility rates, while the MPC layer enforces feasibility and safety constraints. Successful RTO implementation can yield measurable profit improvements of 1–3 % in large refineries.
Soft sensor is a virtual measurement derived from a combination of hard sensor data and a process model. For example, the composition of a vapor stream may be estimated using temperature and pressure measurements together with an equation of state. Soft sensors are valuable when direct analytical instrumentation is expensive, slow, or unavailable.
Process integration is a holistic design philosophy that seeks to minimize energy consumption by linking unit operations. The most common tool is pinch analysis, which identifies the minimum hot and cold utility requirements for a plant and proposes heat‑exchanger network configurations that recover waste heat. By integrating processes, a refinery can reduce steam consumption, lower CO₂ emissions, and improve overall profitability.
Pinch analysis involves constructing composite curves of hot and cold streams, determining the pinch point where the temperature difference between the two curves is the smallest, and designing a heat‑exchanger network that respects that pinch. The method yields the theoretical minimum utility usage and guides the placement of heat exchangers. Pinch analysis is routinely applied to crude pre‑heat trains, distillation columns, and reformer reactors.
Heat integration refers to the practical implementation of pinch recommendations. It includes selecting heat‑exchanger types, sizing, and arranging them to achieve the desired energy savings. For instance, the outlet stream of a catalytic reformer can be used to preheat the feed to a downstream hydrocracker, reducing the need for external steam.
Mass balance is a fundamental accounting of material entering and leaving a unit. In a distillation column, the mass balance for each component ensures that the amount of that component in the feed equals the sum of its amounts in the overhead product, bottom product, and any side streams. Accurate mass balances are the backbone of any process model.
Energy balance tracks the flow of heat and work. For a reactor, the energy balance equates the heat added by the heating system, the heat generated or consumed by the reaction (exothermic or endothermic), and the heat removed by coolant. Energy balances are essential for sizing heat exchangers and ensuring safe temperature control.
Conversion is the fraction of a reactant that has been transformed into products. In a hydrocracking unit, a conversion of 80 % means that 80 % of the feed hydrocarbons have been cracked into lighter fractions. Conversion is a key performance indicator and often appears in the objective function of an optimization problem.
Selectivity measures the preference of a reaction pathway toward a desired product relative to undesired side products. High selectivity in an alkylation unit means that most of the isobutene reacts to form high‑octane alkylate rather than polymerizing into gums. Selectivity is influenced by catalyst type, temperature, and pressure.
Yield is the amount of a specific product obtained per unit of feed. Yield is frequently expressed in mass or volume percent. For a reformer, the gasoline yield is the mass of gasoline produced divided by the mass of feedstock processed. Yield optimization often involves trade‑offs with conversion and selectivity.
Fractionation is the separation of a mixture into its component fractions based on differences in volatility. Distillation is the most common fractionation technique in refineries. Understanding the terminology of fractionation—such as light ends, middle distillates, heavy residues—is essential for designing control strategies that maintain product specifications.
Distillation column is a vertical vessel containing trays or packing that provides contact between rising vapor and descending liquid. Key design parameters include the number of theoretical stages, reflux ratio, reboiler duty, and feed stage location. Control of a column often involves regulating the reflux flow, reboiler heat duty, and feed rate to maintain product cut temperatures.
Reflux ratio is the ratio of liquid returned to the column as reflux to the liquid withdrawn as product. A higher reflux ratio improves separation but increases energy consumption. Optimizing reflux ratio involves balancing product purity against utility costs.
Reboiler duty is the heat input required at the bottom of a distillation column to generate the vapor that drives the separation. It is a major contributor to the plant’s steam demand. In many refineries, reboiler duty is a target for energy‑reduction projects.
Flash drum is a separator that allows a high‑pressure liquid to partially vaporize, producing a vapor stream and a liquid stream in equilibrium. Flash drums are used after high‑pressure reactors to recover light gases and to reduce the pressure before downstream processing. Controlling the drum pressure and temperature is critical to achieving the desired vapor‑liquid split.
Separator can refer to any equipment that splits a multiphase mixture into distinct phases, such as a three‑phase separator that isolates oil, water, and gas. Proper control of separator level, pressure, and temperature ensures safe operation and product quality.
Process safety encompasses the methods and systems used to prevent accidents, protect personnel, and limit environmental impact. Safety analysis techniques such as HAZOP (Hazard and Operability Study) identify potential deviations and prescribe safeguards. In a refinery, safety systems are integrated with control loops, for example through emergency shutdown (ESD) logic that trips critical valves when unsafe conditions are detected.
HAZOP is a structured, systematic technique for examining a process design to identify hazards and operability problems. The study examines each process parameter (flow, temperature, pressure, composition) and asks “What if…?” To uncover possible deviations. The outcomes are recommendations for alarms, interlocks, and procedural changes.
Risk assessment quantifies the likelihood and consequence of identified hazards. It often uses a risk matrix to prioritize actions. In the context of process control, risk assessment informs the selection of alarm setpoints, redundancy levels, and the need for advanced control strategies.
Control strategy defines how a particular process variable will be regulated. It specifies the sensor, controller type, tuning parameters, and any feedforward or cascade loops. For a catalytic reformer, a typical control strategy might involve primary temperature control using a PID loop, secondary pressure control in cascade, and a tertiary hydrogen flow feedforward loop.
Advanced process control (APC) refers to the suite of model‑based techniques that go beyond conventional PID control. APC includes MPC, RTO, and hybrid schemes that use soft sensors and data‑driven models. The deployment of APC can lead to significant improvements in throughput, product quality, and energy efficiency.
Batch vs continuous distinguishes two fundamental modes of operation. Batch processes handle discrete quantities of material, typical for specialty chemicals, while continuous processes, such as most refinery units, run continuously with steady feed streams. Continuous processes benefit from higher utilization and easier integration, but they require more sophisticated control to maintain steady‑state.
Transient refers to the period when the process is moving from one steady‑state condition to another. Transient analysis is vital for start‑up, shutdown, and upset recovery. Dynamic simulation tools are employed to predict transient behavior and to design safe operating procedures.
Time constant characterizes the speed of a first‑order process. It is the time required for the PV to reach approximately 63 % of its final change after a step change in the MV. A short time constant indicates a fast‑responding system; a long time constant suggests sluggish behavior that may require faster actuators or alternative control schemes.
First‑order lag models a process where the rate of change of the PV is proportional to the difference between the current PV and its steady‑state value. Many temperature and level control loops can be approximated as first‑order lag processes, facilitating controller tuning.
Second‑order dynamics arise when inertia or oscillatory behavior is present, such as in fluid‑filled pipelines or large vessels. The response includes overshoot and ringing, requiring more careful tuning and sometimes the use of derivative action to dampen oscillations.
Process instrumentation includes all devices used to measure, control, and monitor a plant. Key categories are flow meters, temperature transmitters, pressure sensors, level transmitters, and analytical instruments. Selecting appropriate instrumentation, ensuring proper installation, and maintaining calibration are essential for reliable control.
Flow meter measures the volumetric or mass flow of liquids and gases. Types include turbine, Coriolis, ultrasonic, and differential pressure meters. In a refinery, accurate flow measurement is crucial for feedstock accounting, product blending, and compliance with regulations.
Temperature transmitter converts the temperature measured by a sensor (thermocouple or RTD) into a standardized signal (4‑20 mA) for the control system. The transmitter may include linearization, compensation for ambient temperature, and diagnostics to detect sensor failure.
Pressure sensor provides a signal proportional to the pressure of a fluid. In high‑pressure reactors, pressure sensors must be rated for the operating range and designed to resist corrosion from aggressive media such as hydrogen sulfide.
Level transmitter measures the height of a liquid in a vessel. Technologies include radar, ultrasonic, and guided‑wave radar. Accurate level measurement is required for safe operation of storage tanks, reactors, and separators.
Online analyzer performs continuous chemical analysis of process streams. Techniques such as gas chromatography (GC), mass spectrometry (MS), and infrared spectroscopy provide real‑time composition data. Online analyzers enable rapid adjustments of feed rates and catalyst regeneration schedules.
Gas chromatography separates components of a gas or liquid mixture based on their interaction with a stationary phase. In a refinery, GC is used to monitor product octane numbers, sulfur content, and light‑end composition. The data feed directly into control loops that adjust reactor temperatures and catalyst dosing.
Mass spectrometry identifies and quantifies molecules based on their mass‑to‑charge ratio. It is especially useful for detecting trace contaminants, such as benzene or hydrogen sulfide, in product streams. Integration of MS data with control systems supports stringent product specification compliance.
Process data historian stores time‑stamped process variables for later analysis. Historians enable performance monitoring, trend analysis, and the development of data‑driven models. They are also the source of information for post‑incident investigations.
SCADA (Supervisory Control and Data Acquisition) provides a graphical interface for operators to monitor and control plant processes. SCADA systems aggregate data from distributed control systems (DCS), alarms, and historians, and allow manual intervention when required.
DCS (Distributed Control System) is the primary automation platform in modern refineries. It hosts the control loops, alarm management, and advanced control algorithms. The DCS architecture is modular, allowing for scalability and redundancy to meet reliability requirements.
Digital twin is a high‑fidelity virtual replica of a physical plant. It integrates real‑time data, physics‑based models, and machine‑learning algorithms to predict performance, diagnose faults, and test control strategies before implementation. Digital twins are emerging as a cornerstone of Industry 4.0 Initiatives in refining.
Energy efficiency measures the ratio of useful product output to the total energy input. Energy‑efficiency improvement projects target reduction of steam consumption, optimization of heat‑exchanger networks, and minimization of pump and compressor power. Energy efficiency is closely linked to economic optimization because utilities often represent a large share of operating costs.
Yield optimization involves adjusting operating conditions to maximize the amount of high‑value products while meeting quality constraints. For example, in an alkylation unit, the operator may increase the catalyst temperature to boost gasoline yield, but must ensure that the resulting product still meets octane specifications.
Product specification defines the acceptable ranges for properties such as boiling point, sulfur content, viscosity, and octane number. Control systems must maintain process variables within bounds that guarantee the final product meets these specifications. Failure to do so can lead to off‑spec shipments and financial penalties.
Utility consumption encompasses the use of steam, electricity, cooling water, and compressed air. Monitoring utility consumption at the unit level helps identify inefficiencies and supports the development of cost‑saving measures. Controllers that regulate reboiler duty, pump speed, and compressor load directly influence utility usage.
Constraint in optimization terminology is a limit that must not be violated. Constraints can be physical (e.G., Maximum temperature of a reactor), operational (e.G., Minimum reflux ratio), or economic (e.G., Budgeted utility cost). In MPC, constraints are enforced at each control interval to guarantee safe operation.
Objective function is the mathematical expression that the optimizer seeks to maximize or minimize. In refinery RTO, the objective function may be profit = revenue – cost, where revenue depends on product yields and market prices, and cost includes feedstock price, energy consumption, and catalyst expense.
Variable refers to any quantity that can be changed within the model, such as feed rate, temperature, pressure, or composition. Variables are classified as decision variables (controlled by the optimizer) or parameters (fixed inputs).
Parameter is a fixed input to a model, such as reaction rate constants, heat‑transfer coefficients, or equipment capacities. Accurate parameter estimation is essential for reliable model predictions and successful optimization.
Feedstock is the raw material supplied to the refinery, typically crude oil or intermediate streams such as naphtha or gas oil. Feedstock quality (API gravity, sulfur content, metal concentration) strongly influences the choice of operating conditions and catalyst selection.
Product slate is the mix of products produced by a refinery at a given time. The product slate is shaped by market demand, feedstock availability, and plant configuration. Adjusting the product slate often requires re‑optimizing the entire plant to meet new profitability targets.
Reactor design involves selecting the type (fixed‑bed, fluidized‑bed, slurry), sizing, and operating conditions (temperature, pressure, residence time) to achieve desired conversion and selectivity. Reactor design parameters are tightly coupled to downstream separation equipment, making integrated optimization essential.
Catalyst accelerates chemical reactions without being consumed. Catalysts in petroleum processing include zeolites for cracking, sulfided metal particles for hydroprocessing, and acidic sites for alkylation. Catalyst activity, selectivity, and lifespan are key considerations in process control.
Catalyst deactivation occurs due to fouling, sintering, poisoning, or coking. Monitoring catalyst performance through online analyzers and adjusting regeneration schedules are part of the control strategy to maintain optimal activity.
Heat‑exchanger network (HEN) is the arrangement of heat exchangers that accomplishes the required heat transfer between hot and cold streams. HEN synthesis uses pinch analysis results to decide the number, type, and connections of exchangers. Proper control of inlet and outlet temperatures ensures the network operates close to its design intent.
Trays are horizontal plates with perforations or weirs that provide stagewise contact between vapor and liquid in a distillation column. Tray performance is described by parameters such as efficiency, pressure drop, and capacity. Tray failure or fouling can cause flooding, reducing separation efficiency.
Packed columns use random or structured packing material instead of trays to increase surface area for vapor‑liquid contact. Packed columns are often used for low‑pressure, high‑throughput separations such as gas absorption. Packing selection influences pressure drop and mass‑transfer efficiency.
Fouling is the accumulation of deposits on heat‑transfer surfaces, trays, or packing, which impairs performance. Fouling leads to increased pressure drop, reduced heat transfer, and altered mass transfer. Control measures include regular cleaning, use of anti‑fouling additives, and monitoring of temperature differentials.
Pressure drop across a unit is the loss of pressure due to friction and flow resistance. Excessive pressure drop can increase pump work and affect downstream equipment. In control terms, pressure drop can be a disturbance that impacts flow rates and level readings.
Level control maintains the liquid height in vessels such as reactors, separators, and storage tanks. Level control loops often use a cascade arrangement, where the primary loop controls the level and the secondary loop controls the valve opening. Level control is critical for safety, preventing over‑filling or dry‑run conditions.
Flow control regulates the rate of fluid movement using control valves, variable‑frequency drives, or pump speed adjustments. Flow control loops may be configured as cascade, with a primary controller setting a flow‑rate setpoint and a secondary controller adjusting the valve position.
Temperature control is perhaps the most common form of process control, given the sensitivity of reaction kinetics and separation efficiency to temperature. Temperature control strategies can include direct heating, steam jacket control, or indirect control through adjusting reflux flow.
Pressure control ensures that reactors, compressors, and pipelines operate within design limits. Pressure control loops may employ bleed valves, compressors, or surge tanks as actuators. Pressure control is often coupled with flow control to maintain a desired operating point.
Composition control uses analytical data to adjust process variables that affect product composition. For example, the ratio of n‑butane to iso‑butane in a gasoline blend can be regulated by adjusting the feed rate to an alkylation unit based on online GC measurements.
Alarm management defines the hierarchy, priority, and response for alarms generated by the control system. Effective alarm management reduces operator overload, ensures timely response to critical events, and improves overall safety. Alarms must be linked to meaningful actions and reviewed regularly.
Setpoint tracking is a performance metric that evaluates how closely a control loop follows its desired setpoint over time. Metrics such as integral of absolute error (IAE) or integral of squared error (ISE) quantify tracking performance and guide controller tuning.
Control performance encompasses stability, speed of response, disturbance rejection, and robustness. Performance can be assessed using standard tests such as step response, relay (or auto‑tuning) tests, and frequency‑response analysis.
Robustness refers to the ability of a control system to maintain performance despite model uncertainties, parameter variations, and external disturbances. Robust control design techniques, such as H‑infinity synthesis, aim to guarantee stability margins under worst‑case scenarios.
Dead‑band is a range around the setpoint where no corrective action is taken. Dead‑bands are used to prevent excessive actuator wear due to frequent small adjustments, but they can also introduce tracking error if set too wide.
Anti‑windup is a control‑algorithm feature that prevents the integral term from accumulating excessively when the actuator is saturated. Without anti‑windup, the controller may experience large overshoots when the actuator finally becomes available.
Gain scheduling adjusts controller parameters based on operating point. Since many refinery processes are highly nonlinear, a single set of PID parameters may not provide satisfactory performance across the entire operating envelope. Gain‑scheduling tables are generated from dynamic models or empirical data.
Cascade control employs two loops in series, where the primary loop controls the primary variable (e.G., Temperature) and the secondary loop controls a secondary variable (e.G., Flow) that directly influences the primary variable. Cascade control improves disturbance rejection, especially for fast disturbances that affect the secondary variable.
Multivariable control addresses the interaction between multiple interrelated variables. In a hydrocracker, temperature, pressure, and hydrogen flow are coupled; a change in one influences the others. Multivariable control techniques, such as MPC, handle these interactions explicitly.
Decoupling is the process of designing control actions that minimize the effect of a change in one MV on other PVs. Decoupling matrices can be derived from the process model and incorporated into the controller to improve independent control of each variable.
Feedforward‑feedback hybrid combines the anticipatory nature of feedforward with the error‑correction capability of feedback. The hybrid approach is widely used in refinery units where measurable disturbances (e.G., Feed composition) can be compensated before they affect product quality.
Soft‑sensor calibration ensures that the virtual measurements derived from models remain accurate. Calibration may involve periodic comparison with laboratory analyses and adjustment of model parameters.
Data‑driven modeling uses historical process data to develop statistical or machine‑learning models that predict PV behavior. Techniques such as regression, neural networks, and support vector machines can capture complex nonlinear relationships without explicit first‑principles equations. Data‑driven models are valuable for fault detection, soft‑sensor development, and rapid prototyping of control strategies.
Fault detection and diagnosis (FDD) identifies abnormal operation based on deviations between measured and predicted values. FDD systems generate alarms, suggest corrective actions, and can trigger automatic mitigation procedures. In a refinery, FDD may detect a leaking valve, a fouled heat exchanger, or a catalyst deactivation event.
Predictive maintenance leverages sensor data and analytics to forecast equipment failure before it occurs. By monitoring vibration, temperature, and pressure trends, maintenance can be scheduled proactively, reducing unplanned downtime and extending equipment life.
Utility optimization focuses on reducing consumption of steam, electricity, water, and compressed air. Strategies include heat integration, variable‑speed drives for pumps and fans, and load shifting of non‑critical loads to off‑peak periods. Utility optimization is often integrated with RTO to achieve simultaneous product and energy profit maximization.
Economic modeling translates physical process performance into financial terms. Cost coefficients for feedstock, utilities, catalyst, labor, and waste disposal are combined with production rates to calculate profit. Economic models are essential inputs to RTO and to feasibility studies for plant modifications.
Scenario analysis evaluates how different market or operational conditions affect plant performance. Scenarios may include changes in crude price, product demand, regulatory limits, or equipment outages. Scenario analysis helps management make informed decisions about capacity expansion, investment, or operational flexibility.
Sensitivity analysis quantifies how changes in input parameters affect output variables. For example, a sensitivity study may reveal that a 1 % increase in feed sulfur content reduces gasoline octane by 0.2 Points, guiding the need for additional desulfurization capacity.
Process bottleneck is the unit that limits overall plant throughput. Identifying bottlenecks is a prerequisite for optimization, as increasing capacity elsewhere yields no benefit unless the bottleneck is addressed. Bottleneck analysis often involves material‑balance calculations and capacity utilization data.
Capacity utilization measures the percentage of a unit’s design capacity that is actually used. High utilization indicates efficient use of assets, but may also increase wear and reduce flexibility. Control strategies must balance utilization with the ability to respond to market or feedstock changes.
Load‑following describes the ability of a plant or individual unit to adjust production rates in response to demand fluctuations. Load‑following capability is increasingly important in markets with volatile fuel prices or renewable‑energy integration. Control systems must be robust enough to handle rapid setpoint changes without compromising product quality.
Safety‑instrumented system (SIS) is a dedicated, independent system that performs safety‑related functions, such as emergency shutdown. The SIS operates in parallel with the normal control system and follows standards such as IEC 61511. SIS design includes safety integrity level (SIL) assessment, redundancy, and periodic testing.
Safety integrity level (SIL) quantifies the reliability required for a safety function. SIL 1 to SIL 4 correspond to increasing levels of risk reduction. Determining the appropriate SIL for a valve, sensor, or controller involves probability‑of‑failure‑on‑demand (PFD) calculations.
Redundancy improves reliability by providing duplicate components or pathways. In a refinery, critical sensors may be backed up by a second sensor, and control loops may have primary and secondary controllers. Redundancy must be managed to avoid unintended interactions, such as “fight” between parallel controllers.
Control valve sizing ensures that the valve can handle the required flow range without excessive pressure drop or cavitation. Proper sizing improves control accuracy, reduces wear, and minimizes energy consumption. Valve sizing calculations consider the flow coefficient (Cv), fluid properties, and required flow range.
Valve characteristics describe the relationship between valve opening and flow capacity. Common types are linear, equal‑percentage, and quick‑opening. Selecting the appropriate characteristic matches the valve to the process dynamics; for large flow ranges, equal‑percentage valves often provide better control.
Actuator converts the control signal into mechanical motion to move the valve. Actuators can be pneumatic, hydraulic, or electric. Electric actuators are gaining popularity due to their precise positioning, low maintenance, and ability to integrate with digital control systems.
Control loop performance monitoring involves continuous assessment of loop metrics such as IAE, ISE, and variance. Monitoring tools flag loops that deviate from expected performance, prompting retuning or investigation. Automated performance monitoring is a key component of an integrated control strategy.
Loop retuning is the periodic adjustment of controller parameters to adapt to changes in process dynamics, equipment aging, or operating point shifts. Retuning may be performed manually, using tuning software, or automatically through adaptive control algorithms.
Adaptive control modifies controller parameters in real time based on observed process behavior. Adaptive control can maintain optimal performance even as the process model changes due to fouling, catalyst deactivation, or feedstock variation.
Process analytical technology (PAT) refers to systems that monitor and control manufacturing processes through real‑time measurements. In petroleum processing, PAT includes spectroscopic analyzers, online chromatography, and model‑based estimators that feed directly into control loops.
Regulatory compliance requires adherence to environmental and safety standards, such as limits on sulfur emissions, wastewater discharge, and occupational exposure. Control systems are integral to compliance, providing the data and actions needed to stay within permitted limits.
Emission control technologies such as flue‑gas desulfurization, selective catalytic reduction, and vapor recovery units are linked to process control. Controllers regulate reagent flow, temperature, and pressure to ensure that emissions remain below regulatory thresholds.
Process safety management (PSM) is a systematic framework that combines engineering, procedures, training, and control system design to prevent catastrophic releases. PSM elements include process hazard analysis, mechanical integrity programs, and operator training, all of which rely on accurate control and instrumentation.
Operator training simulator (OTS) provides a realistic environment for operators to practice normal and upset scenarios. OTSs are built on dynamic models that replicate plant behavior, allowing trainees to experience the impact of control actions without risk to the actual plant.
Human‑machine interface (HMI) is the visual and interactive component through which operators monitor and manipulate the control system. Good HMI design follows principles of clarity, consistency, and prioritization of critical information, reducing the likelihood of operator error.
Control philosophy documents the overall approach to controlling each unit, including the hierarchy of loops, setpoint strategy, alarm philosophy, and contingency procedures. The control philosophy serves as a reference for engineers, operators, and auditors.
Performance indicator (KPI) measures key aspects of plant performance, such as throughput, energy intensity, product yield, and safety statistics. KPIs are tracked over time and compared against targets to drive continuous improvement.
Continuous improvement is a cultural and methodological approach that seeks incremental gains in efficiency, safety, and profitability. In the context of process optimization and control, continuous improvement may involve periodic review of control strategies, adoption of new technologies, and refinement of economic models.
Process data analytics applies statistical and machine‑learning techniques to historical and real‑time data to uncover patterns, predict trends, and support decision‑making. Analytics can detect early signs of equipment degradation, forecast product demand, and suggest optimal setpoint adjustments.
Machine learning algorithms such as random forests, gradient boosting, and deep neural networks can model complex relationships between process variables.
Key takeaways
- Understanding the vocabulary that underpins these activities is essential for any professional seeking the Advanced Skill Certificate in Petroleum Refining and Petrochemistry.
- Steady‑state describes a condition in which all process variables such as temperature, pressure, flow rates, and compositions remain constant over time, despite ongoing material and energy flows.
- These models are indispensable for designing control strategies, performing startup and shutdown studies, and evaluating the impact of process upsets.
- It consists of a sensor that measures a process variable (PV), a controller that compares the PV with a desired setpoint (SP), and a final control element (FCE) such as a valve that manipulates the process.
- Proper tuning of the three parameters (Kp, Ki, Kd) is vital; an overly aggressive proportional gain can cause oscillations, whereas insufficient integral action may leave a persistent offset.
- In a hydrocracking unit, the setpoint for reactor pressure might be 1500 kPa, while the setpoint for reactor temperature could be 380 °C.
- Accurate PV measurement is critical; sensor drift or fouling can lead to erroneous control actions and potential off‑spec production.