
Big Data and Cloud Computing in Maritime Sector
Big Data in the maritime domain refers to the massive volumes of information generated by ships, ports, logistics chains and regulatory bodies. The scale of data is measured not only in terabytes but often in petabytes, driven by high‑frequ…
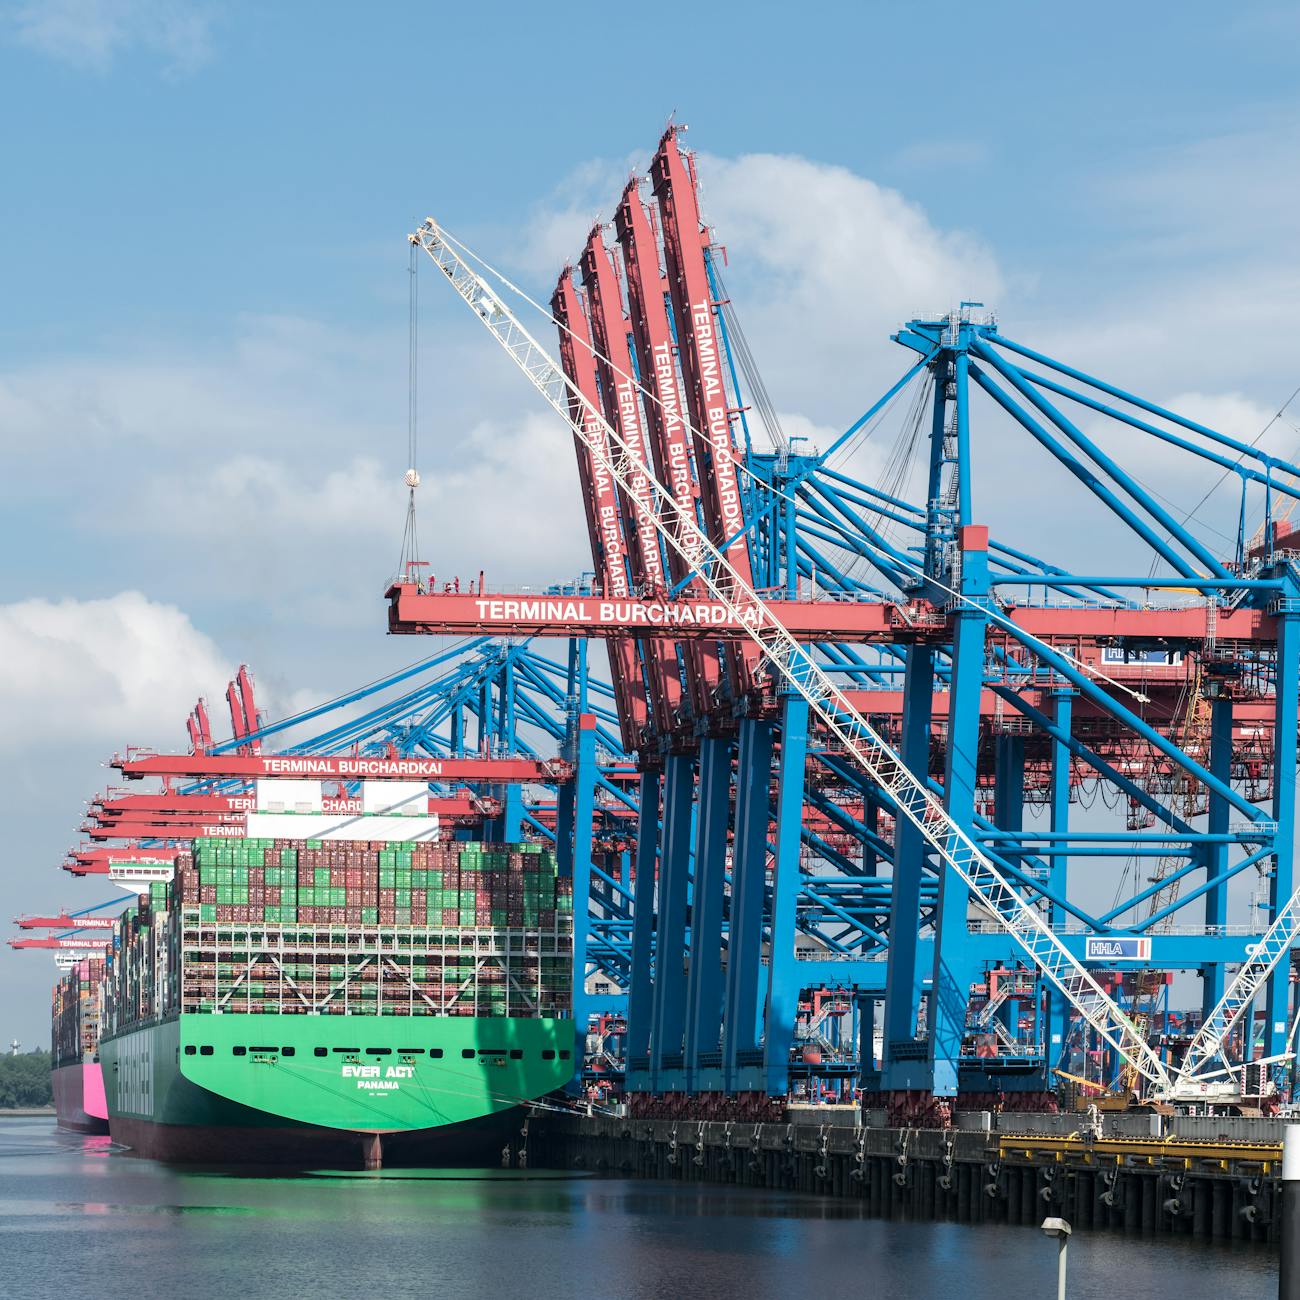
Big Data in the maritime domain refers to the massive volumes of information generated by ships, ports, logistics chains and regulatory bodies. The scale of data is measured not only in terabytes but often in petabytes, driven by high‑frequency sensors, satellite imagery, and global positioning systems. A typical modern container vessel may emit thousands of data points per minute from its engine monitoring system, fuel consumption meters, and cargo temperature sensors. When multiplied by the global fleet of more than 90,000 merchant ships, the cumulative data flow becomes overwhelming for traditional processing tools. Understanding the characteristics of maritime big data—volume, velocity, variety, and veracity—is the first step for analysts who must transform raw streams into actionable insight.
The term volume captures the sheer size of datasets. For example, the Automatic Identification System (AIS) network records position reports from every commercial vessel every few seconds. Over a single day, AIS alone can generate upwards of 10 million messages, each containing attributes such as ship name, MMSI, latitude, longitude, speed over ground, and heading. When combined with ancillary sources like weather models, port call schedules, and customs documentation, the overall dataset expands dramatically.
Velocity describes the rapid rate at which maritime data are produced and must be processed. Real‑time monitoring of vessel traffic, fuel consumption anomalies, or piracy alerts requires near‑instantaneous ingestion and analysis. A delay of even a few minutes can mean the difference between a proactive reroute and an avoidable incident. Consequently, maritime analytics platforms often employ streaming architectures that can handle data in motion, applying filters and aggregations on the fly.
Variety reflects the diverse formats and origins of maritime data. Structured data appear in relational tables—e.g., port authority manifests—while semi‑structured formats include JSON payloads from IoT devices attached to cargo containers. Unstructured data encompass satellite images, crew logbooks scanned as PDFs, and audio recordings of bridge communications. Each type demands specific preprocessing techniques, from parsing and schema mapping to image recognition and natural language processing.
Veracity addresses the trustworthiness and quality of the data. Sensor drift, communication drop‑outs, and manual entry errors can introduce noise. For instance, a faulty AIS transponder may broadcast an inaccurate position, leading to false collision warnings. Data cleansing routines, outlier detection algorithms, and cross‑validation with independent sources (such as radar tracks) are essential to maintain analytical integrity.
Cloud Computing provides the elastic infrastructure needed to store, process, and analyze these massive maritime datasets. Rather than maintaining on‑premises servers that must be over‑provisioned for peak loads, shipping companies can lease compute resources on demand. This model supports both batch processing for historical trend analysis and real‑time analytics for operational decision‑making.
One of the foundational cloud concepts is elasticity. Elasticity allows a maritime analytics platform to automatically scale its compute clusters up when a sudden surge of AIS messages arrives during a major storm, and scale down when traffic returns to normal levels, thereby optimizing cost. The related notion of scalability refers to the ability of a system to handle increasing data loads by adding more nodes or storage without redesigning the architecture. In practice, a container shipping line might start with a modest cluster to process monthly performance reports and later expand to a larger fleet of vessels, adding more sensors and data sources as the business grows.
The cloud service model most commonly adopted for maritime analytics is Infrastructure as a Service (IaaS). IaaS provides virtual machines, storage volumes, and networking components that can be configured to host custom analytics pipelines. For organizations preferring higher‑level abstractions, Platform as a Service (PaaS) offers managed databases, streaming services, and machine‑learning environments, reducing the operational burden of software maintenance. A typical PaaS deployment might use a managed data lake to ingest raw sensor feeds, a serverless function to cleanse the data, and a built‑in analytics workspace to run predictive models.
A crucial storage concept is the data lake. Unlike a traditional data warehouse that stores data in a highly structured schema, a data lake retains information in its native format—whether CSV, Parquet, Avro, or raw binary. This flexibility is valuable for maritime use cases where new sensor types are introduced regularly. For example, a port authority may add a novel air‑quality monitor to its environmental compliance program; the data lake can accommodate the new readings without requiring a schema redesign. Over time, curated subsets of the lake can be transformed into a data warehouse for reporting, enabling a layered architecture that balances agility with performance.
In the maritime context, the data warehouse typically houses cleaned, integrated, and aggregated data ready for business intelligence tools. A shipping company might construct a warehouse that consolidates vessel fuel consumption, cargo weight, and route efficiency metrics, allowing analysts to generate dashboards that compare the performance of different ship classes. The warehouse schema is often designed using a star or snowflake model, where fact tables capture quantitative measurements (e.g., fuel usage) and dimension tables provide contextual attributes (e.g., vessel type, port region).
Machine Learning (ML) and Artificial Intelligence (AI) are increasingly employed to extract patterns from maritime big data. Predictive maintenance, for instance, leverages ML models trained on historical engine sensor data to forecast component failures before they occur. By analyzing vibration signatures, temperature trends, and oil quality measurements, the model can issue early warnings, allowing maintenance crews to schedule repairs during planned port stays rather than reacting to unexpected breakdowns at sea.
Another prominent application is predictive analytics for voyage optimization. By integrating weather forecasts, ocean currents, and vessel performance profiles, algorithms can suggest optimal speed and route adjustments that minimize fuel consumption while meeting delivery deadlines. Real‑time recalculations are possible when a sudden storm appears on the forecast, prompting the system to reroute ships around hazardous zones. The resulting fuel savings translate directly into lower emissions, supporting environmental compliance initiatives such as the IMO’s Initial IMO 2020 sulfur cap.
The maritime sector also benefits from digital twins, virtual replicas of physical assets that are continuously synchronized with sensor data streams. A digital twin of a container ship can simulate hull stress, ballast water distribution, and cargo stability under varying sea conditions. By running what‑if scenarios in the cloud, operators can evaluate the impact of different loading plans or speed profiles without risking actual voyages. The twin’s fidelity depends on high‑quality data ingestion and low latency communication, highlighting the importance of robust network infrastructure.
Edge computing complements cloud processing by moving computation closer to the data source. Onboard a vessel, edge devices can perform preliminary analytics—such as anomaly detection on engine parameters—before transmitting only relevant alerts to the cloud. This approach reduces bandwidth consumption, which is critical when ships rely on satellite links with limited throughput and high latency. Edge analytics also enhance resilience; if the satellite connection drops, the ship can still monitor its own health and take corrective actions autonomously.
A central challenge in maritime big data is data integration. Data originate from heterogeneous systems—AIS transponders, electronic chart display and information systems (ECDIS), port community systems, and customs databases—each using distinct protocols and data models. Integrating these streams requires establishing common identifiers, such as the IMO number for vessels or the container ID for cargo units. Data‑mapping tools and master‑data‑management processes help reconcile discrepancies, but the effort is non‑trivial and often consumes significant project time.
Another persistent issue is data security and privacy. Maritime data can be sensitive, encompassing cargo manifests, route plans, and crew details. Unauthorized disclosure could expose commercial secrets or jeopardize national security. Cloud providers address these concerns through encryption at rest and in transit, role‑based access control, and compliance certifications (e.g., ISO 27001). However, shipping companies must also implement their own governance policies, defining who can view, modify, or export data, and conducting regular audits to detect breaches.
The concept of service level agreement (SLA) is vital when selecting a cloud partner for maritime analytics. An SLA outlines performance guarantees such as uptime, data durability, and maximum response time for support tickets. For mission‑critical applications—like real‑time collision avoidance systems—a stringent SLA with multi‑region redundancy may be required to ensure uninterrupted service. Negotiating appropriate penalties for missed SLA targets can incentivize providers to maintain high reliability.
In terms of data processing frameworks, Apache Spark and Flink are prominent choices for maritime big data workloads. Spark offers a unified engine for batch and interactive analytics, supporting languages such as Python, Scala, and Java. It can process large AIS datasets to compute vessel density heatmaps over time. Flink, with its native streaming capabilities, excels at low‑latency event processing, making it suitable for monitoring live port congestion and triggering alerts when berth occupancy exceeds thresholds. Both frameworks can run on cloud-managed services, reducing the operational overhead of cluster provisioning.
Geospatial analytics is a cornerstone of maritime data science. Vessel trajectories, port call durations, and maritime boundary enforcement all require spatial reasoning. Geographic Information System (GIS) tools integrated with cloud platforms enable analysts to overlay AIS tracks on nautical charts, calculate distance traveled, and detect deviations from planned routes. An example application is the identification of illegal fishing activity: by comparing vessel positions against protected marine areas, authorities can flag potential violations for further investigation.
A related term is geo‑fencing, the creation of virtual perimeters around specific maritime zones. When a ship's AIS signal crosses a geo‑fence—such as an exclusive economic zone (EEZ) boundary—the system can automatically generate notifications for customs or coast guard agencies. Geo‑fencing logic can be expressed as simple latitude/longitude polygons stored in a cloud database, with real‑time checks performed by streaming processors.
The maritime sector also employs Internet of Things (IoT) devices to enrich data collection. Smart containers equipped with temperature, humidity, and shock sensors transmit condition reports to the cloud, allowing shippers to monitor cargo integrity throughout the journey. IoT gateways on board can aggregate these sensor streams, apply edge analytics, and forward summarized metrics to central repositories. The proliferation of IoT devices introduces challenges related to device management, firmware updates, and network reliability, especially in the harsh marine environment.
An emerging paradigm is blockchain for secure and immutable maritime data sharing. By recording container hand‑over events on a distributed ledger, stakeholders—including shippers, freight forwarders, and port operators—gain a shared view of cargo status. Smart contracts can automate payments once predefined conditions, such as successful delivery, are met. While blockchain offers transparency, it also raises concerns about scalability, as the volume of transactions can become substantial when tracking millions of containers annually.
The concept of multi‑tenancy is relevant when multiple shipping lines share a common cloud analytics platform. Multi‑tenancy enables the isolation of each tenant’s data while allowing them to benefit from shared infrastructure. Proper data partitioning, encryption, and access controls are essential to prevent cross‑tenant data leakage. Cloud providers often supply built‑in multi‑tenant capabilities, but architects must still design logical data models that respect each tenant’s privacy requirements.
A practical example of a maritime analytics workflow might proceed as follows: AIS messages are ingested via a cloud‑based streaming service, where they are first parsed and enriched with vessel metadata from an external reference database. The enriched stream is then written to a data lake in a columnar format (e.g., Parquet) for long‑term storage. Simultaneously, a Spark job reads the latest batch of AIS data to compute vessel density maps, which are stored in a data warehouse for reporting. An edge‑deployed anomaly detection model monitors engine sensor data on the ship; when a deviation exceeds a defined threshold, an alert is pushed to the cloud, where a serverless function routes the notification to the vessel’s operations center and updates a dashboard. This end‑to‑end pipeline illustrates the interplay of big data ingestion, cloud processing, edge analytics, and visualization.
When implementing such pipelines, one must consider latency requirements. Real‑time safety applications demand sub‑second response times, whereas strategic fleet performance dashboards can tolerate minutes of delay. Choosing appropriate technologies—such as low‑latency messaging queues versus batch‑oriented storage—helps meet these differing service expectations.
Another challenge is data governance. Maritime organizations often operate across multiple jurisdictions, each imposing distinct regulations on data retention, privacy, and reporting. For instance, the European Union’s General Data Protection Regulation (GDPR) mandates strict handling of personal data, which may include crew information embedded in vessel logs. Cloud architectures must therefore support region‑specific data residency, enabling data to be stored and processed within designated geographic boundaries. Tagging mechanisms and automated policy enforcement tools assist in maintaining compliance.
The role of containerization in maritime analytics cannot be overlooked. By packaging analytics components—such as data ingestion agents, transformation scripts, and model inference services—into Docker containers, developers achieve portability across on‑premises edge devices and cloud environments. Orchestration platforms like Kubernetes manage container lifecycles, scaling instances up or down based on demand. This approach aligns with the cloud‑native philosophy of microservices, fostering modularity and rapid iteration.
In the realm of visualization, maritime analysts rely on dashboards that combine map‑based displays with time‑series charts. Cloud‑based Business Intelligence (BI) tools can render interactive heatmaps of vessel traffic, overlay weather layers, and allow users to drill down into individual ship details. For example, a port operator may select a congested berth on the map and instantly view the queue of vessels awaiting docking, along with their estimated arrival times derived from predictive models. Effective visualizations help translate complex data patterns into actionable decisions for stakeholders.
A critical operational concept is the port call optimization. By integrating berth availability, pilot scheduling, and cargo handling capacity, analytics platforms can recommend optimal arrival windows for inbound ships, reducing idle time at anchor. Cloud‑based simulation engines can evaluate thousands of scheduling permutations, identifying the configuration that minimizes overall turnaround time while respecting labor regulations. Successful implementation of port call optimization can yield significant cost savings and improve berth utilization rates.
The term cognitive analytics describes the use of advanced AI techniques—such as natural language processing (NLP) and computer vision—to extract insights from unstructured maritime data. For instance, OCR (optical character recognition) applied to scanned bill‑of‑lading documents can automatically extract container numbers and consignee details, feeding them into the analytics pipeline. Similarly, computer‑vision models can analyze satellite images to detect oil spills, vessel hull fouling, or illegal dumping activities, triggering alerts for environmental agencies.
In terms of regulatory compliance, the International Maritime Organization (IMO) mandates reporting of emissions data under the IMO 2023 carbon intensity reduction scheme. Shipping companies must collect fuel consumption data, calculate CO₂ emissions per transport work unit, and submit reports to designated authorities. Cloud platforms can automate this workflow by aggregating fuel sensor readings, applying standard emission factors, and generating compliance reports in the required format. The ability to scale processing for large fleets ensures timely submission and reduces the risk of penalties.
A notable challenge in maritime big data is the handling of missing or incomplete data. AIS signals may be intermittent due to coverage gaps, while sensor logs can contain null values caused by hardware faults. Imputation techniques—such as interpolation, regression models, or probabilistic methods—are employed to fill gaps, but analysts must assess the impact on downstream predictions. Transparent documentation of imputation methods is essential for auditability and for maintaining stakeholder trust.
The concept of data lineage tracks the origin and transformation history of each data element. In maritime analytics, lineage information helps answer questions such as: which AIS feed contributed to a particular vessel trajectory, and what cleaning steps were applied before the data entered the warehouse? Maintaining lineage supports reproducibility, facilitates debugging of data quality issues, and satisfies regulatory requirements that demand traceability of reported metrics.
When discussing cloud deployment models, public cloud versus private cloud considerations arise. Public cloud providers offer vast economies of scale and a rich ecosystem of services, making them attractive for bulk data processing. However, some maritime operators prefer private clouds—hosted on dedicated hardware or within a virtual private network—to retain tighter control over data sovereignty and to meet strict security policies. Hybrid approaches, where sensitive data reside in a private environment while less critical workloads run on public infrastructure, provide a balanced solution.
A further technical term is serverless computing. Serverless platforms abstract away the underlying servers, allowing developers to focus solely on code. In a maritime scenario, a serverless function could be triggered by a new AIS file landing in cloud storage, automatically invoking a transformation routine that normalizes timestamps and enriches records with vessel type information. Because billing is based on execution time rather than reserved capacity, serverless can be cost‑effective for sporadic processing tasks.
The importance of data cataloging cannot be overstated. As maritime data repositories proliferate, a centralized catalog helps users discover available datasets, understand their schemas, and assess data quality. Cloud‑based data catalog services enable tagging, lineage visualization, and access control enforcement. For example, a data analyst searching for “container temperature readings” can quickly locate the relevant data lake folder, view its schema, and request appropriate permissions—all within a governed environment.
In the area of predictive fleet management, organizations employ machine‑learning models to forecast vessel arrival times (ETA) with higher accuracy than traditional deterministic methods. By ingesting historical voyage data, weather forecasts, and real‑time AIS positions, the model learns patterns that account for vessel-specific performance and sea state influences. Accurate ETAs enable better coordination with port operators, reduce demurrage costs, and improve customer satisfaction.
A practical challenge in implementing predictive models is model drift. Over time, the statistical properties of input data may shift due to changes in ship design, fuel types, or regulatory constraints. Continuous monitoring of model performance, coupled with periodic retraining on recent data, mitigates drift. Cloud MLOps platforms provide pipelines that automate data versioning, model training, validation, and deployment, ensuring that the analytics stay current with evolving maritime conditions.
The term container orchestration refers to the automated management of container lifecycles, scaling, and networking. Kubernetes, as the de‑facto standard, offers features such as auto‑scaling, rolling updates, and self‑healing. In maritime analytics, a Kubernetes cluster can host microservices responsible for ingesting AIS streams, performing geospatial joins, and serving API endpoints for external stakeholders. The declarative nature of Kubernetes manifests simplifies the replication of environments across development, testing, and production stages.
A recurring operational concern is cost management. Cloud resources—compute instances, storage buckets, data transfer—incur ongoing expenses. Shipping firms must implement budgeting tools, set alerts for unexpected usage spikes, and adopt cost‑optimization strategies such as reserved instances for predictable workloads or spot instances for non‑critical batch jobs. Detailed cost reports enable finance teams to attribute expenses to specific projects, such as “cargo monitoring” or “fuel efficiency analysis.”
The concept of high‑availability (HA) ensures that critical maritime services remain operational despite component failures. Cloud architectures achieve HA through multi‑zone deployments, redundant data replication, and automated failover mechanisms. For a vessel‑tracking API serving global customers, HA guarantees that a loss of a single data center does not disrupt service, preserving trust and meeting SLA commitments.
A specialized term is maritime domain awareness (MDA). MDA encompasses the comprehensive understanding of the maritime environment, including vessel movements, cargo flows, and potential threats. Big data and cloud computing empower MDA by aggregating disparate sources—AIS, radar, satellite imagery, and open‑source intelligence—into unified analytics platforms. Decision makers can then assess risks, allocate resources, and respond to incidents with greater situational awareness.
In the context of environmental monitoring, satellite‑derived sea‑surface temperature (SST) data are often combined with vessel emissions records to evaluate the impact of shipping on marine ecosystems. Cloud‑based geospatial processing pipelines can overlay emission hotspots on SST anomalies, supporting research on climate change and informing policy discussions. The scalability of cloud services enables the processing of high‑resolution satellite datasets alongside massive AIS archives, delivering insights that would be infeasible on traditional infrastructure.
A key term for data exchange standards is UN/EDIFACT, a widely used electronic data interchange (EDI) format for shipping documents such as the Bill of Lading and the Booking Confirmation. Cloud integration platforms can parse EDIFACT messages, map fields to internal data models, and store the resulting records in relational databases. By automating the ingestion of EDI traffic, organizations reduce manual data entry errors and accelerate the flow of information across the supply chain.
The Internet of Maritime Things (IoMT) extends the IoT concept to the maritime domain, encompassing not only shipboard sensors but also shore‑based equipment like crane load cells, berth lighting systems, and security cameras. IoMT architectures often employ a layered approach: edge devices perform local aggregation, a regional hub forwards compressed data to the cloud, and centralized analytics derive insights for operational optimization. The heterogeneity of IoMT devices—varying communication protocols (e.g., LoRaWAN, cellular, satellite) and power constraints—poses integration challenges that must be addressed through standardized data models and flexible ingestion pipelines.
A practical example of IoMT in action is the monitoring of refrigerated containers (reefers). Sensors inside the container measure temperature, humidity, and door status, transmitting data via cellular networks to a cloud platform. An analytics engine detects temperature excursions and triggers alerts to the cargo owner, who can then coordinate with the port operator to prioritize unloading and re‑conditioning. This proactive approach reduces spoilage risk and improves supply‑chain reliability.
When dealing with high‑throughput data, the concept of back‑pressure becomes relevant. In streaming architectures, back‑pressure mechanisms prevent downstream components from being overwhelmed by upstream data bursts. For instance, if a real‑time AIS ingestion service receives a surge of messages during peak traffic hours, back‑pressure signals the source to slow the rate of transmission or buffer excess records until processing capacity catches up. Proper back‑pressure handling ensures system stability and prevents data loss.
A further technical term is data partitioning. Partitioning divides large datasets into smaller, manageable chunks based on a key such as date, vessel ID, or geographic region. In cloud storage, partitioned data enables parallel processing, faster query performance, and efficient data lifecycle management (e.g., archiving older partitions to cheaper storage tiers). For maritime analytics, a common partitioning scheme might be “year/month/vessel‑type,” allowing analysts to quickly retrieve relevant subsets for performance reporting.
The notion of time‑series databases (TSDB) is important for storing sensor data that is inherently chronological, such as engine temperature or propeller RPM. TSDBs are optimized for high‑write throughput and efficient range queries over time intervals. In the maritime setting, a TSDB can retain per‑vessel sensor streams for the duration of a voyage, enabling rapid retrieval of performance metrics during post‑voyage analysis or during real‑time anomaly detection.
A related concept is windowed aggregation, a technique used in stream processing where data are grouped into fixed or sliding windows (e.g., 5‑minute intervals) before aggregating. For example, a streaming job might compute the average speed of each vessel over the last ten minutes, updating the result every minute. Windowed aggregation balances the need for timely insights with the computational cost of continuous per‑event calculations.
In terms of data quality, the term data provenance captures the origin and transformation history of a data item. Provenance metadata—such as the source system, ingestion timestamp, and processing steps—helps analysts assess reliability and trace errors back to their root cause. Cloud data catalogs often store provenance attributes alongside the data assets, supporting audit trails required by regulatory bodies.
The Open Geospatial Consortium (OGC) defines standards for sharing geospatial data, such as the Web Feature Service (WFS) and Web Map Service (WMS). Maritime analytics platforms that expose vessel position layers or port congestion heatmaps can leverage OGC services to interoperate with third‑party GIS applications, enhancing collaboration across agencies and commercial partners.
A strategic initiative in many shipping companies is the development of a single customer view (SCV). An SCV aggregates all interactions a customer has with the carrier—booking requests, shipment status updates, invoice history—into a unified profile. By integrating data from CRM systems, booking platforms, and AIS tracking, the SCV enables personalized service offerings, targeted marketing, and improved customer satisfaction. Cloud data warehouses serve as the backbone for constructing and maintaining the SCV.
In the realm of cybersecurity, zero‑trust architecture is gaining traction for maritime cloud deployments. Zero‑trust principles require continuous verification of every access request, regardless of network location. Implementing zero‑trust involves strong authentication mechanisms (e.g., multi‑factor authentication), micro‑segmentation of network zones, and fine‑grained policy enforcement. For a cloud‑based vessel monitoring platform, zero‑trust helps protect sensitive operational data from insider threats and external attacks.
A critical operational metric is mean time between failures (MTBF). By analyzing sensor data across a fleet, analysts can estimate the average interval between component failures, informing maintenance scheduling and spare parts inventory planning. Cloud‑based analytics can compute MTBF at scale, providing insights for each ship class and equipment type, thereby optimizing maintenance budgets.
In the context of environmental regulations, the term energy efficiency design index (EEDI) represents a mandatory measure of a new ship’s CO₂ efficiency, calculated based on its capacity and propulsion characteristics. Shipping companies can use cloud analytics to simulate different design configurations, assess their impact on the EEDI, and select the most compliant and cost‑effective options before construction.
The concept of digital freight forwarding describes the transformation of traditional freight brokerage into a technology‑driven, data‑centric service. By integrating AIS data, customs filings, and carrier schedules within a cloud platform, digital freight forwarders can provide instant rate quotes, automated booking, and end‑to‑end visibility. This shift relies heavily on big‑data pipelines and scalable cloud infrastructure.
A practical challenge when scaling maritime analytics is network bandwidth constraints. Satellite links, while essential for offshore connectivity, often provide limited throughput and incur high latency. To mitigate these constraints, edge devices compress data, prioritize critical alerts, and batch less urgent records for transmission during off‑peak periods. Cloud services that support throttling and adaptive data ingestion help align with variable bandwidth availability.
The term reference data denotes static datasets that provide context for transactional data. In maritime analytics, reference data includes vessel registries (IMO numbers, flag states), port codes (UN/LOCODE), and commodity classifications (HS codes). Maintaining accurate and up‑to‑date reference data is essential for data enrichment, reporting consistency, and regulatory compliance.
A growing area of interest is quantum‑ready computing, where organizations prepare their data pipelines for future quantum algorithms that could solve complex optimization problems, such as route planning under multiple constraints. While quantum hardware is still emerging, cloud providers are beginning to offer quantum simulators, allowing maritime analysts to experiment with quantum‑inspired techniques on existing data.
When evaluating cloud providers, the metric of data egress cost is crucial. Egress fees apply when data are transferred out of the cloud to on‑premises systems or external partners. Shipping firms that frequently export reports to regulatory agencies must account for these costs in their budgeting. Strategies to reduce egress expenses include using cloud‑based visualization tools, compressing data before transfer, and leveraging regional data replication to keep traffic within the same geographic zone.
A key term for collaborative data sharing is data marketplace. Cloud platforms often host marketplaces where organizations can publish curated datasets—such as historical weather archives or port performance statistics—for others to subscribe to. Maritime stakeholders can monetize proprietary data (e.g., proprietary vessel performance benchmarks) while gaining access to external datasets that enrich their analytics.
In the field of risk assessment, probabilistic models estimate the likelihood of adverse events such as piracy attacks, equipment failure, or regulatory fines. By feeding historical incident data, geopolitical risk indices, and real‑time vessel location into a cloud‑based Monte Carlo simulation, analysts can generate risk scores for each voyage. These scores support decision‑making around route selection, insurance coverage, and contingency planning.
A technical challenge specific to maritime big data is the handling of non‑Cartesian coordinate systems. While most geospatial data use latitude/longitude, certain navigation charts employ Mercator or polar stereographic projections. Converting between coordinate systems requires careful transformation to avoid distortion, especially when overlaying AIS tracks on high‑resolution bathymetric maps. Cloud GIS services typically provide built‑in reprojection capabilities, but developers must remain aware of the underlying assumptions.
The concept of service orchestration involves coordinating multiple cloud services to achieve a business workflow. For example, a port call workflow might orchestrate: (1) an event‑driven function that detects an inbound vessel’s AIS arrival, (2) a database query that retrieves the vessel’s berth allocation, (3) a notification service that informs terminal operators, and (4) a reporting service that logs the event for performance metrics. Orchestration tools such as AWS Step Functions or Azure Logic Apps enable the definition of these sequences with built‑in error handling and retry logic.
A practical illustration of predictive congestion management uses machine‑learning models to forecast berth occupancy levels 24 hours in advance. Input features include historical berth usage patterns, scheduled arrivals, weather forecasts, and labor shift schedules. The model outputs a probability distribution for each berth’s availability, allowing the port authority to pre‑emptively adjust inbound traffic or allocate resources to mitigate anticipated bottlenecks. Cloud‑based training pipelines can retrain the model daily as new data arrive, ensuring forecasts remain accurate.
When dealing with multi‑modal transport—integrating sea, rail, and road legs—analysts employ intermodal analytics. By correlating AIS vessel positions with rail yard schedules and truck GPS traces, a unified view of cargo movement emerges. This holistic perspective enables optimization of handover times, reduction of dwell periods, and improvement of overall supply‑chain reliability. Cloud data lakes serve as the central repository for storing the diverse datasets required for intermodal analysis.
A common data‑exchange format in maritime IoT is MQTT (Message Queuing Telemetry Transport). MQTT is a lightweight publish‑subscribe protocol designed for constrained networks, making it suitable for ship‑to‑shore communication where bandwidth is limited. Edge devices onboard vessels publish sensor readings to an MQTT broker, which can be hosted in the cloud. Subscribers—such as analytics services—receive the data in near‑real time, enabling prompt anomaly detection.
The term semantic enrichment refers to augmenting raw data with contextual meaning derived from ontologies. In maritime analytics, a maritime ontology may define relationships between vessel types, cargo categories, and regulatory regimes. By mapping AIS messages to this ontology, analysts can perform more sophisticated queries—for instance, retrieving all bulk carriers operating under a specific flag that are transporting hazardous materials. Semantic enrichment facilitates smarter search and reasoning capabilities within the analytics platform.
A strategic initiative known as smart ports leverages big data and cloud computing to automate and optimize port operations. Sensors embedded in quay cranes, gate barriers, and yard equipment generate streams of operational data that are ingested into a cloud platform. Analytics dashboards visualize equipment utilization, predict maintenance windows, and suggest optimal crane assignments based on real‑time container arrival patterns. The integration of IoT, edge analytics, and cloud orchestration forms the backbone of the smart‑port ecosystem.
In the context of fleet performance, the metric fuel‑specific consumption (FSC) quantifies the amount of fuel used per unit of cargo moved over a given distance. FSC is derived from sensor data on fuel flow rates, cargo weight, and voyage distance. Cloud‑based analytics can benchmark FSC across vessels, identify outliers, and recommend operational changes—such as speed reductions or hull cleaning—to improve efficiency. Reducing FSC contributes directly to lower emissions and compliance with carbon‑reduction targets.
A technical term often encountered is data sharding. Sharding distributes a dataset across multiple storage nodes based on a shard key, improving parallelism and fault tolerance. For maritime AIS archives, sharding by year and geographic region enables parallel queries for historical traffic analysis while isolating failures to specific shards. Cloud databases such as Cosmos DB or Bigtable provide built‑in sharding mechanisms that simplify implementation.
When integrating legacy maritime systems, the concept of API gateway becomes relevant. An API gateway acts as a unified entry point for external applications, handling protocol translation, request routing, authentication, and rate limiting. Legacy ship‑to‑shore communication systems that expose proprietary protocols can be wrapped by an API gateway, exposing standardized RESTful endpoints to cloud services. This approach facilitates gradual migration of legacy assets into a modern cloud architecture.
A practical example of real‑time compliance monitoring involves continuously checking a vessel’s emissions against the IMO’s carbon‑intensity threshold for its trade route. Sensor data on fuel flow and engine load are streamed to a cloud analytics engine that calculates instantaneous CO₂ emissions. If the emissions exceed the allowed limit, the system triggers an alert and recommends corrective actions, such as speed adjustment or alternative routing. The real‑time nature of the solution ensures compliance before penalties accrue.
The term data residency describes the legal requirement that certain data remain within specific geographic boundaries. For maritime operators with multinational operations, data residency considerations affect where cloud storage buckets are provisioned. For instance, personal crew data collected under European privacy laws must reside in EU‑located data centers. Cloud providers offer region‑specific services to satisfy these constraints, and orchestration scripts can route data accordingly during ingestion.
In the area of automation, the use of robotic process automation (RPA) helps streamline repetitive tasks such as invoice reconciliation, customs documentation filing, and berth allocation updates. RPA bots can interact with legacy web portals, extract required information, and feed it into cloud databases, reducing manual effort and error rates. When combined with AI‑driven decision support, RPA enables end‑to‑end automation of complex maritime workflows.
A critical performance indicator for data pipelines is throughput, measured in records per second or megabytes per second. High‑throughput ingestion is essential for handling the continuous flood of AIS messages and sensor streams. Cloud streaming services provide configurable throughput quotas, and scaling policies can be tuned to match expected peak loads. Monitoring tools alert engineers when throughput approaches capacity, prompting proactive scaling actions.
The concept of data retention policy defines how long different categories of data are kept before archival or deletion. Maritime regulators may require AIS data to be retained for a minimum of two years, while sensor logs might be archived for five years for maintenance analysis. Cloud storage tiers—hot, cool, and archive—allow cost‑effective management of data lifecycle, moving older data to cheaper, slower storage while keeping recent data readily accessible.
A specialized term is maritime safety management system (SMS). An SMS integrates operational data, incident reports, and compliance records to promote a culture of safety. Cloud‑based dashboards can display safety metrics, track corrective actions, and provide audit trails for regulatory inspections. By consolidating data from multiple sources—crew logs, equipment sensors, and external incident databases—the SMS supports proactive risk mitigation.
When discussing data processing, the phrase extract‑transform‑load (ETL) describes the classic pipeline for moving data from source systems into a data warehouse. In maritime analytics, ETL jobs may extract raw AIS files, transform coordinates, enrich with vessel metadata, and load into a structured table for reporting. Modern cloud platforms often replace traditional ETL with ELT (extract‑load‑transform), leveraging the compute power of the data warehouse to perform transformations at
Key takeaways
- Understanding the characteristics of maritime big data—volume, velocity, variety, and veracity—is the first step for analysts who must transform raw streams into actionable insight.
- Over a single day, AIS alone can generate upwards of 10 million messages, each containing attributes such as ship name, MMSI, latitude, longitude, speed over ground, and heading.
- Consequently, maritime analytics platforms often employ streaming architectures that can handle data in motion, applying filters and aggregations on the fly.
- Each type demands specific preprocessing techniques, from parsing and schema mapping to image recognition and natural language processing.
- Data cleansing routines, outlier detection algorithms, and cross‑validation with independent sources (such as radar tracks) are essential to maintain analytical integrity.
- Rather than maintaining on‑premises servers that must be over‑provisioned for peak loads, shipping companies can lease compute resources on demand.
- Elasticity allows a maritime analytics platform to automatically scale its compute clusters up when a sudden surge of AIS messages arrives during a major storm, and scale down when traffic returns to normal levels, thereby optimizing cost.