
Applications of Maritime Data Analytics in Real-world Scenarios
Automatic Identification System (AIS) is the backbone of modern maritime data collection. It is a transponder that continuously broadcasts a vessel’s identity, position, speed, heading, and other navigational details. The data are received …
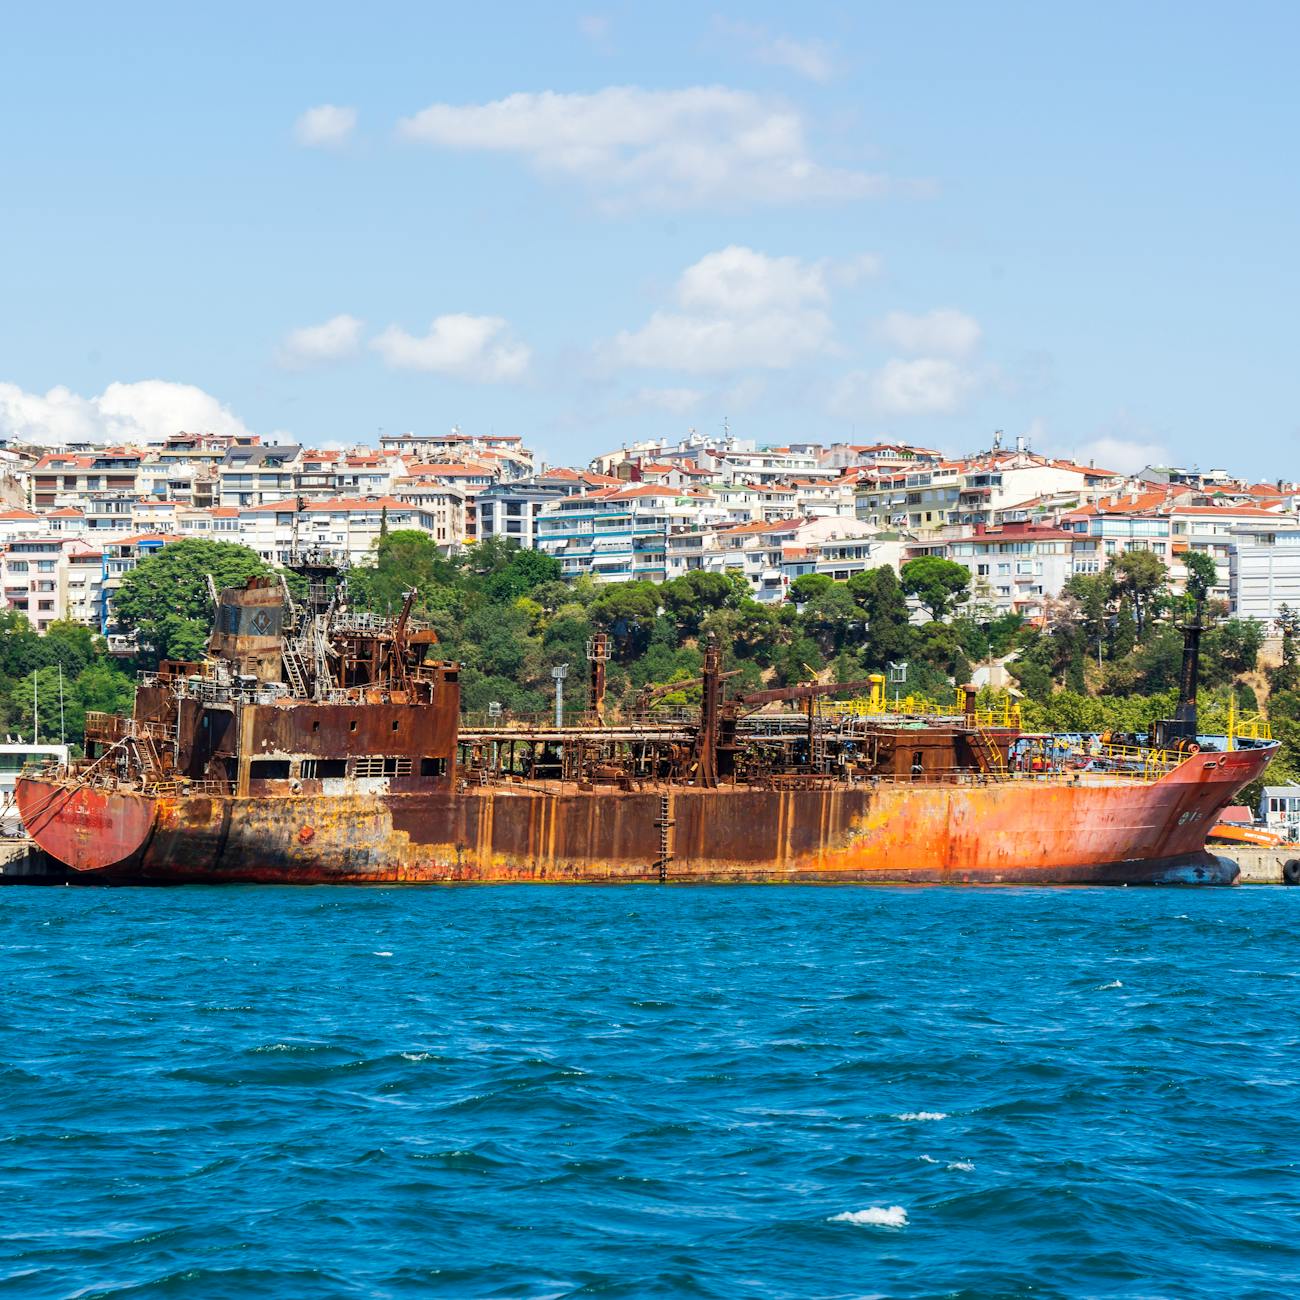
Automatic Identification System (AIS) is the backbone of modern maritime data collection. It is a transponder that continuously broadcasts a vessel’s identity, position, speed, heading, and other navigational details. The data are received by shore‑based stations, satellites, and other vessels, creating a dense stream of real‑time information. In practice, AIS enables the monitoring of traffic density in congested waterways such as the Strait of Malacca, where analysts can identify bottlenecks by aggregating vessel positions over time. A common challenge is data quality; AIS signals may be intermittent in remote regions, leading to gaps that require interpolation or the use of complementary sources such as radar or satellite imagery.
Vessel Traffic Service (VTS) is a shore‑based service that uses AIS, radar, and communication links to manage ship movements within a defined area. VTS operators rely on analytics to predict arrival times, assess collision risk, and allocate berthing slots. For instance, a VTS centre in Rotterdam uses a predictive model that incorporates vessel draft, tide levels, and historical berth occupancy to recommend optimal arrival windows. The main difficulty lies in integrating heterogeneous data streams while maintaining low latency, as decision support must be delivered in near‑real time to avoid delays.
Geofencing refers to the creation of virtual boundaries around sensitive maritime zones such as ecological reserves, pipelines, or offshore wind farms. By mapping AIS positions against these boundaries, analysts can generate alerts when a vessel breaches a zone. A practical example is the enforcement of exclusion zones around the Great Barrier Reef, where automated alerts trigger notifications to both the vessel’s master and the coastal authority. The key technical hurdle is the precise definition of the geofence; inaccuracies in the underlying chart data can produce false positives, eroding trust in the system.
Route Optimization uses historical and real‑time data to compute the most efficient path between origin and destination. Variables include sea currents, wind forecasts, fuel consumption curves, and vessel performance characteristics. Shipping companies often employ optimization engines that solve mixed‑integer linear programs to minimize fuel cost while respecting delivery windows. In a case study of a container carrier operating between Asia and Europe, a route‑optimization model reduced fuel usage by 5 % and cut emissions by several thousand tonnes per year. However, the model’s success depends on the reliability of external data sources such as weather models, which may have limited spatial resolution in certain oceanic regions.
Predictive Maintenance leverages sensor data from engines, propellers, and auxiliary systems to anticipate equipment failures before they occur. Vibration analysis, temperature monitoring, and oil quality measurements feed into machine‑learning algorithms that classify the health state of components. A real‑world deployment on a fleet of bulk carriers used a gradient‑boosted tree model to predict bearing wear, allowing maintenance crews to schedule repairs during scheduled port calls rather than during voyages. The primary obstacle is the scarcity of labeled failure data; many failures are rare events, requiring techniques such as synthetic minority oversampling to balance the training set.
Machine Learning is a collection of statistical methods that enable computers to learn patterns from data without explicit programming. In maritime analytics, supervised learning is often used for classification tasks such as identifying vessel types from AIS messages, while unsupervised learning supports clustering of traffic patterns. A notable example is the use of random‑forest classifiers to differentiate between fishing vessels and cargo ships based on speed‑over‑ground distributions. One challenge is model interpretability; stakeholders may be reluctant to trust a black‑box model without clear explanations of why a particular vessel was flagged as suspicious.
Deep Learning extends machine learning by employing multi‑layer neural networks that can automatically extract hierarchical features. Convolutional neural networks (CNNs) are applied to satellite imagery to detect oil spills, while recurrent neural networks (RNNs) process sequential AIS data for trajectory prediction. A project in the Gulf of Mexico trained a CNN on synthetic aperture radar images to achieve a 92 % detection rate for small‑scale spills. The computational cost of deep learning models is a major concern; training on large maritime datasets often requires GPU clusters or cloud‑based services, raising operational expenses.
Neural Networks consist of interconnected nodes that simulate the behavior of biological neurons. In the maritime domain, feed‑forward networks are used to model non‑linear relationships between vessel speed, fuel consumption, and emission rates. For example, a shipowner implemented a three‑layer neural network to estimate CO₂ output under varying load conditions, enabling more accurate reporting to regulatory bodies. The difficulty lies in selecting appropriate hyperparameters such as learning rate and network depth, which typically demands extensive experimentation.
Anomaly Detection focuses on identifying patterns that deviate from normal behavior. In AIS analytics, anomalies may indicate illegal fishing, piracy, or fraudulent flagging. Statistical techniques like the Mahalanobis distance, as well as machine‑learning approaches such as isolation forests, are employed to flag outliers. A maritime security agency deployed an isolation‑forest model that successfully identified a vessel loitering near a protected marine area, prompting a rapid response. False‑positive rates, however, can be high when normal traffic exhibits high variability, necessitating post‑processing steps to refine alerts.
Port Congestion describes the situation where the demand for berthing exceeds the available capacity, leading to delays and increased emissions. Analytical models combine AIS arrival times, berth occupancy data, and hinterland transport constraints to forecast congestion levels. In a study of the Port of Los Angeles, a queuing‑theory model predicted peak congestion periods with a 15 % error margin, allowing terminal operators to adjust staffing and equipment deployment. The main limitation is the lack of real‑time visibility into cargo handling operations, which can cause discrepancies between predicted and actual wait times.
Shore Power (also known as cold ironing) enables vessels to plug into the electrical grid while at berth, reducing emissions from auxiliary generators. Data analytics track the duration of shore‑power usage, electricity consumption, and resulting emission reductions. A case in the port of Rotterdam demonstrated that supplying shore power to 30 % of arriving ships cut local NOₓ emissions by 20 %. The primary barrier is the heterogeneity of shipboard electrical systems, which requires standardization of connectors and voltage levels to ensure widespread adoption.
Emission Monitoring involves the measurement and estimation of pollutants such as CO₂, SOₓ, and NOₓ released by ships. Sensors installed on exhaust stacks, combined with fuel flow meters, generate high‑frequency data streams that are aggregated and visualized for compliance reporting. The European Union’s monitoring framework mandates that vessels report emissions on a per‑voyage basis, using data that must be validated against satellite‑derived plume observations. Data gaps and sensor drift pose challenges; robust calibration procedures and redundancy in sensor placement are essential to maintain accuracy.
Ballast Water Management (BWM) is a regulatory requirement aimed at preventing the transfer of invasive species via ballast water. Modern BWM systems incorporate treatment units that record discharge volumes, treatment efficacy, and compliance status. Analytics compare discharge events against predefined risk zones, generating alerts when untreated ballast is released near ecologically sensitive areas. A pilot program in the Baltic Sea used BWM data to identify vessels that repeatedly violated discharge protocols, leading to targeted inspections. The difficulty lies in integrating BWM data, which is often stored in proprietary formats, with broader maritime data platforms.
Geographic Information System (GIS) is a framework for capturing, storing, analyzing, and visualizing spatial data. In maritime analytics, GIS layers include bathymetry, navigational hazards, port infrastructure, and environmental zones. By overlaying AIS trajectories on GIS maps, analysts can assess route compliance with designated traffic separation schemes. A shipping line used GIS to evaluate the impact of a newly opened canal on its Asia‑Europe service, finding a 12 % reduction in voyage distance. The challenge is maintaining up‑to‑date spatial datasets, as chart updates may lag behind actual changes in seabed morphology.
Spatial Analysis examines the geographic distribution of maritime phenomena. Techniques such as kernel density estimation are applied to AIS data to identify high‑traffic corridors, while spatial clustering algorithms detect groups of vessels operating in proximity. In a study of the North Sea, spatial analysis revealed seasonal shifts in fishing activity that correlated with migratory fish patterns. A limitation is the Modifiable Areal Unit Problem (MAUP), where the choice of spatial aggregation can influence analytical outcomes, requiring careful selection of analysis units.
Temporal Analysis focuses on the evolution of maritime data over time. Time‑series decomposition separates trend, seasonal, and irregular components, enabling the detection of long‑term shifts in shipping volumes or fuel prices. For example, a temporal analysis of AIS data over ten years highlighted a gradual increase in average vessel speed, prompting a review of fuel‑efficiency policies. The main obstacle is handling irregular sampling intervals, as AIS messages may be unevenly spaced due to transmission gaps, necessitating resampling or interpolation techniques.
Data Fusion combines multiple data sources to create a richer representation of maritime events. AIS, radar, satellite imagery, and weather data are merged to improve vessel detection accuracy and situational awareness. A fusion pipeline that integrated SAR images with AIS positions increased the detection rate of non‑cooperative vessels by 30 % in a piracy‑prone region. The complexity of data fusion lies in aligning heterogeneous data formats, temporal resolutions, and coordinate reference systems, which often requires custom preprocessing scripts.
Data Quality assesses the accuracy, completeness, consistency, and timeliness of maritime datasets. Quality metrics such as error rate, missing value proportion, and duplication count guide data‑cleansing activities. An audit of AIS logs for a fleet of tankers revealed a 7 % duplicate rate caused by overlapping reception zones, prompting the implementation of de‑duplication algorithms. Maintaining high data quality is an ongoing process; automatic validation rules must be balanced against the risk of discarding legitimate outliers that may represent genuine anomalies.
Data Governance establishes policies, standards, and responsibilities for managing maritime data assets. It defines who can access AIS streams, how long sensor data are retained, and the procedures for data sharing with partners. A consortium of port authorities adopted a data‑governance framework that classified data into public, restricted, and confidential tiers, enabling secure collaboration on joint traffic‑management initiatives. The key difficulty is achieving consensus among stakeholders with differing legal obligations and commercial interests, often requiring negotiation of data‑sharing agreements.
Big Data describes datasets that exceed the capacity of traditional processing tools in terms of volume, velocity, and variety. AIS streams generate billions of records annually, while satellite SAR images add petabytes of raster data. Technologies such as distributed file systems and parallel processing frameworks enable the storage and analysis of these massive datasets. A global shipping analytics firm deployed a Hadoop cluster to process three years of AIS data, extracting weekly traffic patterns in under an hour. The downside is the need for specialized expertise to configure, maintain, and secure big‑data infrastructures.
Cloud Computing offers on‑demand computational resources over the internet, allowing maritime analysts to scale processing power without upfront hardware investment. Services such as serverless functions, managed databases, and AI platforms simplify the deployment of analytics pipelines. For instance, a maritime startup used a cloud‑based data lake to ingest AIS data in real time, applying serverless functions to enrich each record with weather context before storing it for downstream analytics. Concerns include data sovereignty, as some jurisdictions restrict the storage of shipping data on foreign servers, and cost management, since high‑frequency processing can lead to unexpected expenses.
Edge Computing brings computation closer to the data source, reducing latency and bandwidth usage. Onboard sensors on a vessel can run lightweight models to detect engine anomalies, transmitting only alerts to shore offices. A pilot on a cruise ship installed an edge‑analytics module that processed vibration data locally, achieving a 90 % reduction in upstream data traffic while still providing timely maintenance warnings. The trade‑off is limited processing capability on edge devices, which may restrict the complexity of models that can be executed without offloading to the cloud.
Data Lake is a centralized repository that stores raw data in its native format, allowing flexible access for various analytical use cases. AIS messages, ship logs, and weather forecasts can reside together, enabling analysts to explore correlations without predefined schemas. In a maritime research institute, a data lake hosted over 20 TB of heterogeneous data, supporting exploratory studies on route resilience. Governance of a data lake is critical; without proper metadata management, data become “data swamps” that are difficult to discover and reuse.
Data Warehouse stores structured, processed data optimized for reporting and query performance. After cleansing and aggregating AIS data, a data warehouse might contain daily vessel‑activity summaries suitable for business intelligence dashboards. A shipping company migrated its historical AIS archive into a columnar data warehouse, reducing query latency from minutes to seconds for fleet‑wide performance reports. However, the ETL (Extract‑Transform‑Load) pipelines required for warehouse population can be complex and must be kept in sync with source system changes.
ETL (Extract‑Transform‑Load) describes the workflow that moves data from source systems into analytical stores. Extraction pulls raw AIS messages, transformation cleans and enriches the data, and loading writes the results into a warehouse or lake. A typical ETL job for maritime analytics includes steps such as decoding NMEA sentences, converting timestamps to UTC, and joining vessel registry information. Bottlenecks often arise during the transformation phase, especially when applying computationally intensive operations like spatial joins on large datasets.
API (Application Programming Interface) provides programmatic access to maritime data services. AIS providers expose RESTful APIs that deliver vessel positions on demand, while weather services offer endpoints for wind and wave forecasts. By integrating multiple APIs, analysts can build composite applications that, for example, recommend speed adjustments based on predicted sea state. Rate limiting and authentication mechanisms of APIs must be managed carefully; exceeding quotas can interrupt data flows, compromising time‑sensitive analytics.
Real‑time Streaming processes data as it arrives, enabling immediate insights. Stream processing frameworks ingest AIS messages, apply windowed aggregations, and generate alerts for vessel‑behavior anomalies within seconds. A maritime monitoring center used a streaming pipeline to detect sudden course changes that could indicate collision risk, notifying pilots instantly. The challenge is ensuring exactly‑once processing semantics, as duplicate AIS messages can lead to false alerts if not properly deduplicated.
Batch Processing handles large volumes of data in scheduled intervals, suitable for historical analyses such as annual traffic trend reports. Batch jobs may run nightly to compute fuel‑efficiency metrics for each vessel based on the previous day’s AIS and fuel‑consumption logs. While simpler to implement than streaming, batch processing introduces latency, making it unsuitable for operational decision‑making that requires immediate response.
Data Visualization presents complex maritime information in intuitive graphical forms. Heat maps of traffic density, Sankey diagrams of cargo flows, and time‑series charts of emissions are common visual tools. An interactive dashboard allowed a port authority to drill down from a regional traffic heat map to individual vessel tracks, facilitating rapid investigation of suspected illegal fishing. Designing effective visualizations demands an understanding of the target audience; overloaded charts can obscure critical insights, while oversimplified graphics may hide important nuances.
Dashboard is a collection of visual components that display key performance indicators (KPIs) and other metrics in a single view. A maritime KPI dashboard might show berth utilization, average turnaround time, and fuel consumption per nautical mile. By refreshing the dashboard every five minutes with streaming AIS data, operators gain situational awareness that supports proactive decision‑making. Maintaining dashboards requires ongoing data‑pipeline health monitoring; a broken feed can render the display stale, leading to misinformed actions.
KPI (Key Performance Indicator) quantifies the effectiveness of maritime operations. Examples include on‑time arrival rate, cargo‑per‑voyage revenue, and emissions intensity (grams CO₂ per tonne‑kilometer). Selecting appropriate KPIs involves aligning metrics with strategic objectives, such as reducing carbon footprint or improving port throughput. A common pitfall is focusing on easily measurable KPIs while neglecting more impactful but harder‑to‑measure outcomes, which can misguide resource allocation.
Voyage Data Recorder (VDR) captures a ship’s navigational, operational, and communication data for post‑incident analysis. The VDR stream includes AIS, radar, engine parameters, and bridge audio, providing a comprehensive dataset for forensic investigations. In the aftermath of a grounding incident, investigators reconstructed the vessel’s speed profile from VDR data, revealing that a sudden loss of thrust had gone unnoticed due to inadequate alarm settings. Access to VDR data is often restricted by privacy regulations, requiring secure handling and anonymization before analysis.
Electronic Chart Display and Information System (ECDIS) is a digital navigation system that integrates chart data with real‑time vessel positioning. Analytics can extract ECDIS logs to assess compliance with designated routes and to study deviations caused by weather or traffic. A fleet operator analyzed ECDIS data to quantify the frequency of route deviations during storm events, informing the design of more resilient routing policies. Compatibility issues arise when different shipbuilders use varying ECDIS vendors, leading to inconsistencies in data formats that must be normalized for fleet‑wide analysis.
Ship‑to‑Shore Communication (S2S) encompasses the exchange of data between a vessel and on‑shore systems via satellite, VHF, or other radio technologies. S2S enables remote monitoring of engine performance, cargo temperature, and ballast water treatment status. A refrigerated cargo carrier employed S2S to transmit temperature sensor readings every ten minutes, allowing shore personnel to intervene promptly when a refrigeration unit malfunctioned. Bandwidth limitations and latency are typical constraints, especially for high‑frequency telemetry over satellite links.
Satellite AIS expands AIS coverage beyond the range of terrestrial receivers, capturing vessel positions in open ocean. Satellite AIS data are crucial for global traffic monitoring, anti‑piracy operations, and environmental compliance. Analysts combine satellite AIS with sea‑state forecasts to estimate fuel consumption for vessels operating in remote regions where on‑board data are unavailable. The main challenge is the high cost of satellite AIS services, which may limit access for smaller operators, and the need to filter out false detections caused by signal reflections or noise.
VHF Radio (Very High Frequency) is a primary communication channel for ship‑to‑shore and ship‑to‑ship exchanges. VHF traffic includes distress calls, navigation warnings, and routine coordination. By parsing VHF logs, analysts can infer operational patterns such as the frequency of pilotage requests at a busy harbor. Integration of VHF data with AIS enhances situational awareness but requires natural‑language processing to interpret free‑form message content, a task complicated by varying terminology and language use among crews.
Weather Routing uses meteorological forecasts to suggest optimal routes that minimize fuel consumption and exposure to adverse conditions. Routing algorithms ingest wind, wave, and current models, producing a cost surface that balances speed against safety. A shipping line integrated weather routing into its voyage‑planning system, achieving a 3 % reduction in fuel burn across its fleet. The accuracy of weather forecasts diminishes with longer lead times, making it essential to update routes dynamically as new data become available.
Oceanographic Data includes measurements of sea temperature, salinity, currents, and tides. Incorporating oceanographic variables improves the fidelity of fuel‑consumption models, as water density influences hull resistance. A research project combined ocean‑current forecasts with AIS trajectories to identify energy‑saving opportunities for tanker routes through the Gulf Stream. The challenge lies in the spatial sparsity of oceanographic observations; many regions rely on model outputs that may contain biases, requiring validation against in‑situ measurements.
Sea State describes the condition of the ocean surface, characterized by wave height, period, and direction. Sea‑state information is vital for safe navigation and for estimating vessel motion, which affects cargo stability and fuel efficiency. By linking AIS speed data with sea‑state predictions, analysts can detect when vessels reduce speed due to rough seas, informing performance benchmarks. Quantifying sea state in real time is difficult; satellite altimetry provides coarse estimates, while ship‑board wave radars deliver higher resolution but are not universally installed.
Currents influence vessel speed over ground and fuel consumption. Ocean‑current models provide vector fields that can be incorporated into route‑optimization tools. An example is the use of the Global Ocean Data Assimilation System to predict eastward currents in the Indian Ocean, allowing ships to adjust heading to take advantage of favorable flow. Accurate current forecasts are limited by model resolution and the chaotic nature of ocean dynamics, leading to uncertainty that must be accounted for in decision‑support tools.
Wind Forecast supplies directional and speed information that affects both propulsion and maneuverability. Wind‑aware routing can reduce resistance when a vessel aligns with favorable breezes or avoid excessive heeling in strong crosswinds. A container carrier’s navigation system integrated high‑resolution wind forecasts, achieving a modest but measurable reduction in bunker fuel usage. The primary difficulty is reconciling differing forecast timetables; wind models may be updated more frequently than wave models, creating synchronization issues in multi‑parameter routing algorithms.
Port Call denotes the period when a vessel arrives at a port, unloads or loads cargo, and prepares for departure. Analytics track port‑call duration, berth occupancy, and turnaround efficiency. By analyzing historical port‑call data, a terminal operator identified that certain cargo types required longer crane cycles, prompting a redesign of loading procedures that shaved 30 minutes off average turnaround. Data capture for port calls often relies on manual entry, introducing inconsistencies that can be mitigated through automated gate‑in/out sensors.
Berthing Slot is an allocated time window for a vessel to dock at a specific berth. Optimization of berthing slots reduces vessel waiting time and improves terminal throughput. A berth‑allocation model used mixed‑integer programming to assign ships to slots based on vessel size, cargo type, and tidal constraints, achieving a 10 % increase in berth utilization. The model’s success depends on accurate real‑time updates; unexpected delays due to weather or equipment failure can invalidate the schedule, requiring rapid re‑optimization.
Yard Management concerns the organization of shipyard activities such as repairs, retrofits, and painting. Data analytics monitor work‑order progress, resource allocation, and safety compliance. A shipyard implemented a dashboard that combined labor‑hour tracking with equipment usage telemetry, reducing project overruns by 15 %. Integration challenges arise from legacy enterprise‑resource‑planning (ERP) systems that may not expose APIs for easy data extraction.
Hull‑Performance Monitoring uses sensors to measure parameters such as hull strain, fouling level, and water pressure. By correlating hull‑condition data with fuel consumption, operators can schedule hull cleaning at optimal intervals, balancing cleaning costs against fuel savings. A study on a fleet of bulk carriers demonstrated that timely hull cleaning reduced fuel consumption by up to 4 % per voyage. Sensor placement and durability in harsh marine environments are practical concerns, as corrosion and bio‑fouling can degrade sensor accuracy over time.
Fuel‑Consumption Model predicts the amount of fuel required for a given voyage based on vessel characteristics, speed, load, and environmental conditions. Regression models, as well as physics‑based simulators, are employed to estimate consumption. A shipping company calibrated a regression model using historical fuel reports and AIS data, achieving a mean absolute error of 3 % compared with actual bunker records. The model’s reliability hinges on the quality of input data; inaccurate cargo weight declarations can lead to systematic under‑ or over‑estimation of fuel needs.
Carbon Intensity Indicator (CII) is a metric introduced by the International Maritime Organization to measure CO₂ emissions per transport work unit. Analytics calculate CII by dividing total CO₂ emissions by the product of cargo weight and distance travelled. Vessels exceeding the prescribed CII threshold must implement corrective action plans. A freight operator used CII calculations to benchmark its fleet against industry averages, identifying high‑emitting routes that warranted speed reductions or alternative fuel adoption. Calculating CII accurately requires harmonized data on fuel type, carbon content, and cargo mass, which are often stored in disparate systems.
Energy‑Efficiency Operational Index (EEOI) complements CII by evaluating operational measures that improve efficiency, such as slow steaming or hull polishing. The EEOI is expressed as a percentage improvement over a baseline. An analysis of a liner service showed that adopting slow steaming for 20 % of voyages reduced EEOI by 12 %, contributing to compliance with upcoming emissions regulations. The challenge is balancing efficiency gains against commercial constraints, as slower services may affect customer satisfaction and market competitiveness.
Dynamic Positioning (DP) systems automatically maintain a vessel’s position and heading using thrusters, based on real‑time sensor inputs. DP performance data, including thruster usage and power draw, are logged for analysis. A offshore support vessel used DP telemetry to identify periods of excessive thruster activity, leading to a software update that optimized control algorithms and reduced power consumption by 8 %. DP data are high‑frequency and voluminous, requiring efficient storage solutions and real‑time processing capabilities.
Autonomous Vessel refers to a ship capable of operating with minimal or no crew, relying on advanced sensors, AI, and remote monitoring. Data analytics for autonomous vessels focus on perception, decision‑making, and safety verification. A pilot project for an autonomous cargo shuttle employed deep‑learning models to detect obstacles from LiDAR point clouds, achieving reliable detection rates in cluttered harbor environments. Regulatory uncertainty and the need for extensive validation testing represent significant barriers to widespread adoption.
Regulatory Compliance encompasses adherence to international conventions, regional statutes, and port‑state control requirements. Analytics support compliance by automating report generation, flagging non‑conforming events, and providing audit trails. For example, a compliance dashboard aggregated emission data, ballast‑water discharge logs, and crew certification records, enabling a quick response to an inspection request. Maintaining up‑to‑date knowledge of evolving regulations is a continuous effort; automated rule‑engine updates are necessary to avoid inadvertent violations.
Risk Assessment evaluates the probability and impact of adverse events such as collisions, groundings, or environmental spills. Probabilistic models combine traffic density, vessel maneuverability, and weather forecasts to generate risk scores for specific routes. A maritime insurance firm used a Monte‑Carlo simulation to estimate expected loss for a fleet operating in the North Atlantic, informing premium calculations. Data scarcity for rare high‑impact events can limit model robustness, prompting the use of expert elicitation to supplement quantitative analysis.
Supply‑Chain Visibility provides end‑to‑end tracking of cargo movement from origin to destination. By integrating AIS data with container‑tracking systems, shippers can monitor estimated times of arrival and identify delays in real time. A logistics provider built a visibility platform that correlated vessel positions with customs clearance times, allowing proactive rescheduling of inland transport. Integration complexities arise from differing data standards across carriers, terminals, and customs agencies, requiring data‑mapping and transformation layers.
Digital Twin is a virtual replica of a physical asset, such as a ship or port, that mirrors its behavior through continuous data exchange. The digital twin receives sensor streams, updates its state, and runs simulations to predict performance under various scenarios. A shipowner deployed a digital twin of a tanker to test the impact of different ballast‑water treatment cycles on fuel consumption, identifying an optimal schedule that saved both fuel and treatment costs. High‑fidelity digital twins demand extensive sensor deployment and sophisticated modeling, which can be cost‑prohibitive for smaller operators.
Simulation Model recreates maritime processes in a virtual environment to evaluate strategies without affecting real operations. Discrete‑event simulation of port operations can assess the effect of adding a new crane on overall throughput. In a study of a container terminal, simulation results indicated that a single additional gantry crane would reduce average truck dwell time by 12 %. Calibration of simulation models requires accurate input data; mismatches between simulated and actual performance can mislead decision makers.
Scenario Analysis explores the outcomes of alternative future conditions, such as changes in fuel prices, regulatory limits, or climate patterns. By adjusting model parameters, analysts can forecast how a fleet’s operating costs would evolve under different scenarios. A shipping line performed scenario analysis for a transition to low‑sulfur fuel, revealing that the cost increase could be offset by modest speed reductions. The reliability of scenario analysis depends on the plausibility of the assumptions; overly optimistic or pessimistic inputs can skew strategic planning.
Environmental Impact Assessment (EIA) evaluates the potential effects of maritime activities on ecosystems, including noise, underwater turbulence, and pollutant release. Data from AIS, hydroacoustic sensors, and emission monitors feed into models that estimate impact zones. An offshore wind farm developer used AIS‑derived traffic density maps to predict collision risk for construction vessels, adjusting the installation schedule to minimize ecological disturbance. Conducting thorough EIAs often requires interdisciplinary collaboration, and data gaps in marine biology can limit the precision of impact predictions.
Maritime Domain Awareness (MDA) is the comprehensive understanding of all maritime activities that could affect security, safety, or the environment. MDA platforms ingest AIS, radar, satellite, and intelligence feeds, applying analytics to detect emerging threats. A naval command center employed pattern‑recognition algorithms on AIS data to identify unusual vessel clustering near a strategic chokepoint, prompting heightened surveillance. The volume and velocity of data in MDA initiatives demand scalable architectures and robust cybersecurity measures to protect sensitive information.
Cybersecurity in maritime data analytics addresses the protection of communication links, sensor networks, and data repositories from malicious intrusion. Threat modeling identifies vulnerabilities in AIS transmission, satellite links, and onboard control systems. A cyber‑risk assessment revealed that outdated firmware on a vessel’s DP controller could be exploited to disrupt positioning, leading to a remediation plan that included regular patch cycles and network segmentation. Balancing security with operational availability is critical; overly restrictive firewalls may impede legitimate data flows needed for real‑time analytics.
Data Anonymization removes personally identifiable or commercially sensitive information from datasets before sharing or publishing. Techniques such as k‑anonymity and differential privacy are applied to AIS logs to protect vessel owner identities while preserving analytical utility. A research consortium shared anonymized AIS data across multiple jurisdictions, enabling collaborative studies on global traffic patterns without violating privacy regulations. Anonymization must be carefully calibrated; excessive masking can degrade data quality, reducing the effectiveness of downstream models.
Standardization ensures that maritime data adhere to common formats, units, and protocols, facilitating interoperability. Organizations such as the International Organization for Standardization (ISO) publish standards like ISO 19030 for ship‑performance measurement. Adoption of standardized data exchange formats, such as JSON‑based Maritime Data Exchange, streamlines integration between ship‑board sensors and shore‑based analytics platforms. Resistance to standardization can arise from legacy systems that are costly to retrofit, necessitating transitional middleware solutions.
Metadata provides descriptive information about data assets, including source, collection time, coordinate reference system, and data quality metrics. Proper metadata management enables efficient data discovery and provenance tracking. A maritime data lake employed a metadata catalog that indexed AIS files by vessel type, region, and processing level, allowing analysts to locate relevant subsets quickly. Inadequate metadata can lead to misinterpretation of data, especially when merging datasets that use different time zones or units.
Data Stewardship designates individuals responsible for overseeing data assets throughout their lifecycle, ensuring compliance with governance policies and quality standards. In a shipping enterprise, data stewards coordinated between the engineering department (providing sensor data) and the analytics team (consuming the data), establishing data‑validation rules and access controls. Effective stewardship requires clear role definitions and training; otherwise, data ownership ambiguities may result in duplicated effort or neglected data‑quality initiatives.
Artificial Intelligence (AI) encompasses a broad set of techniques that enable machines to perform tasks that normally require human cognition. In maritime contexts, AI drives autonomous navigation, anomaly detection, and decision support. An AI‑driven decision engine suggested optimal speed profiles for a fleet of tankers based on real‑time fuel prices and emission caps, delivering cost savings while maintaining schedule fidelity. The opacity of some AI models can impede regulatory acceptance, prompting the development of explainable‑AI methods that provide insight into model reasoning.
Explainable AI (XAI) seeks to make AI model decisions transparent and understandable to human users. Techniques such as SHAP values or LIME visualizations can highlight which input features contributed most to a vessel‑classification outcome. A maritime security agency deployed XAI to justify alerts generated by an isolation‑forest model, presenting investigators with feature contributions that clarified why a vessel’s speed pattern was deemed anomalous. Implementing XAI adds computational overhead and may require simplifying complex models, potentially reducing predictive performance.
Data Ethics addresses the moral considerations surrounding data collection, analysis, and sharing. Issues include the privacy of crew members, the potential for bias in predictive models, and the responsible use of surveillance data. A shipping consortium adopted an ethics charter that mandated impact assessments before deploying AI‑based monitoring systems, ensuring that the benefits outweighed any unintended harms. Ethical frameworks must be operationalized through concrete policies and oversight mechanisms; otherwise, they remain aspirational statements.
Regulatory Reporting involves submitting mandatory information to authorities, such as emissions reports to the IMO or ballast‑water discharge logs to national agencies. Automated reporting pipelines ingest raw sensor data, apply conversion factors, and generate formatted submissions in accordance with prescribed schemas. A vessel operator achieved a 40 % reduction in reporting labor by implementing an end‑to‑end pipeline that produced the required XML files directly from the onboard data lake. Keeping pace with evolving reporting requirements demands flexible system design, as new fields or validation rules may be introduced without notice.
Port Community System (PCS) is a collaborative platform that integrates data from terminal operators, customs, shipping lines, and logistics providers. By sharing vessel‑arrival forecasts, berth allocations, and cargo manifests, PCS improves coordination and reduces idle time. A PCS implementation enabled a terminal to synchronize crane scheduling with vessel ETA updates, cutting average crane idle time by 18 %. Integration challenges include aligning data standards across participants and managing access rights to protect commercial confidentiality.
Turnaround Time measures the duration between a vessel’s arrival at port and its departure after cargo operations are completed. Analytics break down turnaround time into components such as unloading, loading, and paperwork processing, identifying bottlenecks. A detailed analysis revealed that paperwork processing contributed disproportionately to delays for certain cargo types, leading to the adoption of electronic document exchange that shaved 20 % off overall turnaround. Accurate measurement requires synchronized timestamps from multiple systems, which can be difficult to achieve in fragmented operational environments.
Fuel‑Optimization Strategy combines speed management, route selection, and engine‑tuning to minimize fuel consumption while meeting service requirements. A shipping line implemented a speed‑reduction policy for
Key takeaways
- A common challenge is data quality; AIS signals may be intermittent in remote regions, leading to gaps that require interpolation or the use of complementary sources such as radar or satellite imagery.
- For instance, a VTS centre in Rotterdam uses a predictive model that incorporates vessel draft, tide levels, and historical berth occupancy to recommend optimal arrival windows.
- A practical example is the enforcement of exclusion zones around the Great Barrier Reef, where automated alerts trigger notifications to both the vessel’s master and the coastal authority.
- In a case study of a container carrier operating between Asia and Europe, a route‑optimization model reduced fuel usage by 5 % and cut emissions by several thousand tonnes per year.
- A real‑world deployment on a fleet of bulk carriers used a gradient‑boosted tree model to predict bearing wear, allowing maintenance crews to schedule repairs during scheduled port calls rather than during voyages.
- In maritime analytics, supervised learning is often used for classification tasks such as identifying vessel types from AIS messages, while unsupervised learning supports clustering of traffic patterns.
- Convolutional neural networks (CNNs) are applied to satellite imagery to detect oil spills, while recurrent neural networks (RNNs) process sequential AIS data for trajectory prediction.